Several weeks ago, we forecasted that a bullish time window would start around November 1st. We explained it in great detail in our bullish market forecast for November 2023, it was visible on the chart in the article. Today, we have plenty of evidence that our forecast was accurate. Not only do we continue to expect an end-of-year rally in 2023, we also firmly believe the year-end rally 2023 is already here. It officially kicked off on the date we forecasted a while ago.
Many months ago, we already forecasted a year-end rally. We also mentioned that IF our forecasted year-end rally will materialize, it will be outstanding news for investors in 2024. A year-end rally was required to turn the trend bullish in 2024.
What is the expected trend of the stock market in 2024?
We use our leading indicators to forecast the expected trend of the stock market in 2024 which is directionally bullish.
In the article mentioned in the intro, published mid-August, we said:
Yes, we do expect an end-of-year rally in 2023.” Specifically, we predict that bullish momentum will kick in not later than mid-October of 2023. However, the market has to resolve short-term uncertainties first, as evidenced by the violation of the bullish formation on the chart of the Russell 2000, a leading indicator for broad markets.
Leading indicator: Green light for a year-end rally 2023
As explained in the weekend edition of our new S&P 500, Gold & Silver price analysis service:
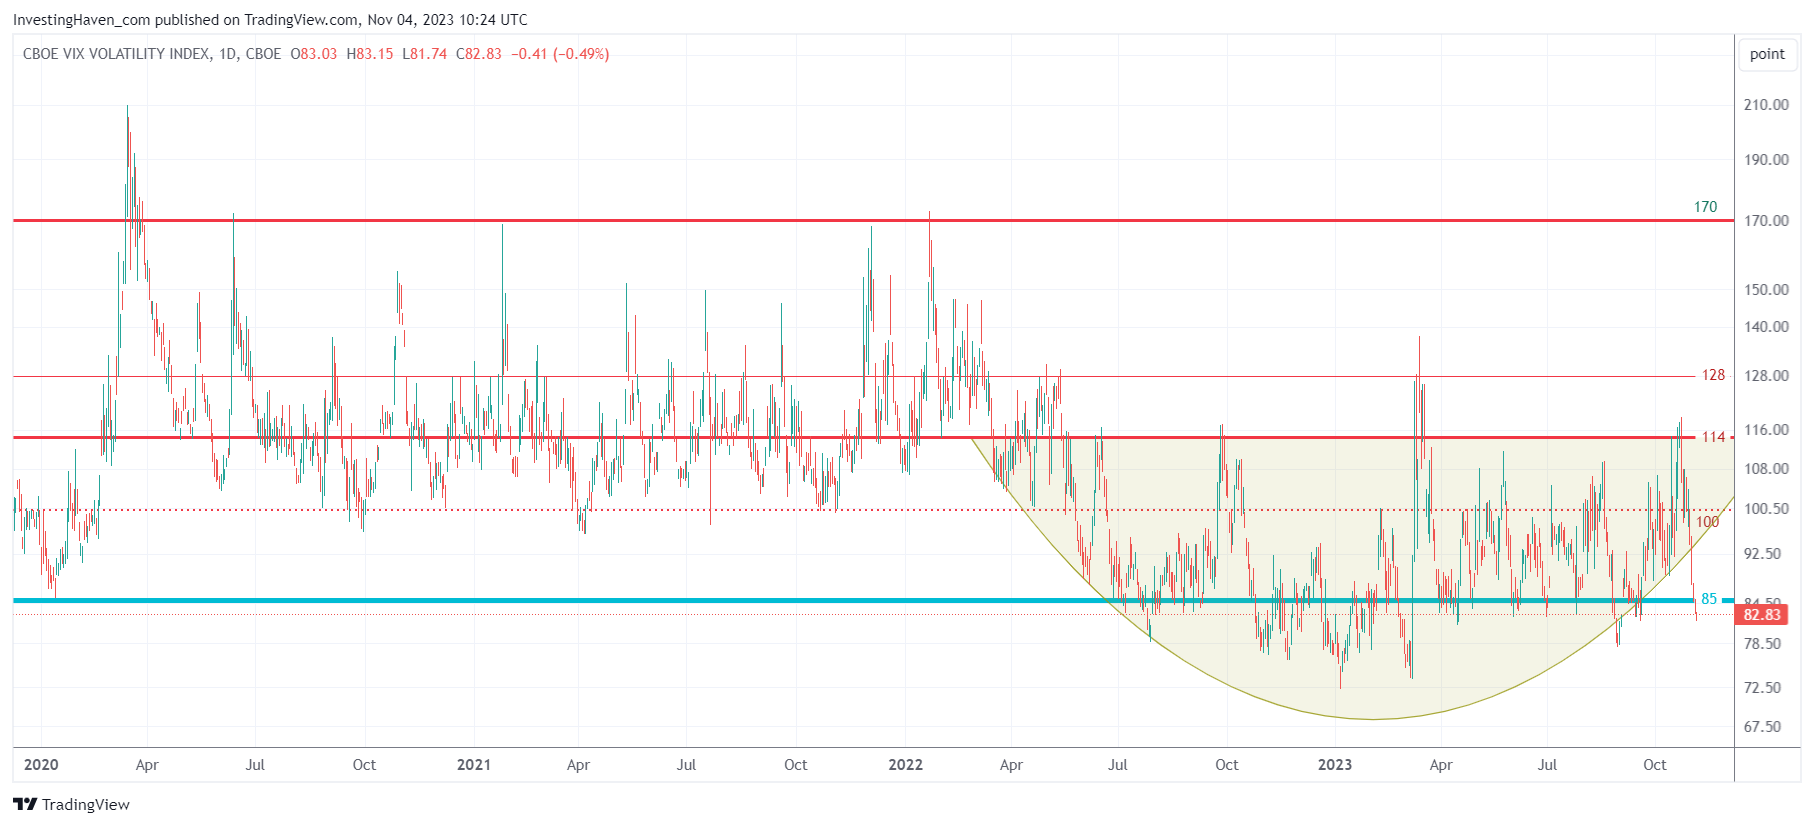
On the next chart, we zoom out to see the structural change VVIX went through since summer of 2022. The take-away from this long term view: recent weakness in the S&P 500 did not bring VVIX to a structurally higher level (the line in the sand being 114 points). This bodes well for the coming weeks and months, maybe even quarters.
This is a quote from our weekend analysis, published in August, exclusive to Momentum Investing members (analysis of broad markets, trends, our favorite sectors):
While our outlook leans towards optimism, we mustn’t disregard potential invalidation factors that could reshape the narrative. A pivotal anchor point to monitor is the VVIX at 114. Should this threshold be crossed, especially surging past 128 points, the specter of heightened volatility looms large.
Another crucial anchor point is the 2-Year Yields at 5%. This level carries weight for sectors sensitive to interest rates. A persistent rise beyond 5.2% could exert substantial pressure on equities.
VVIX stopped rising at 114 points, and 2-Year Yields dropped below 5%, both occurred around November 1st, 2023.
Timeline Analysis: The expected end-of-year rally 2023 started on the forecasted day
Interestingly, the charts we shared in recent months showed the start of a bullish time window to start on November 1st, 2023.
It happened exactly as forecasted – the lows of the recent volatility window was printed a few days before Nov 1st, 2023.
Conclusion
There is sufficient evidence that the year-end rally 2023 has started.
Our leading indicators are confirming this: VVIX found resistance at 114 points, 2-Year Yields found resistance right above 5%, our timeline analysis suggested that November 1st would mark the start of a bullish window.
It all happened, last week. Price action confirmed our time forecast, and leading indicators also confirmed our time forecast.
We believe our methodology in which time and price are analyzed, both separately but also combined, is truly unique. The evidence is there, available even in the public space.


