
KEY TAKEAWAYS
- Gold slipped more than 1% before stabilizing inside the $4,950-$5,000 range.
- Thin holiday liquidity increases the risk of sharp but temporary price swings.
- The $4,950 level aligns with recent swing lows and visible stop clusters.
- A sustained break likely requires strong macro data or meaningful ETF outflows.
Gold is sitting on a tight technical floor as liquidity dries up. A clean break likely needs weak data or heavy selling.
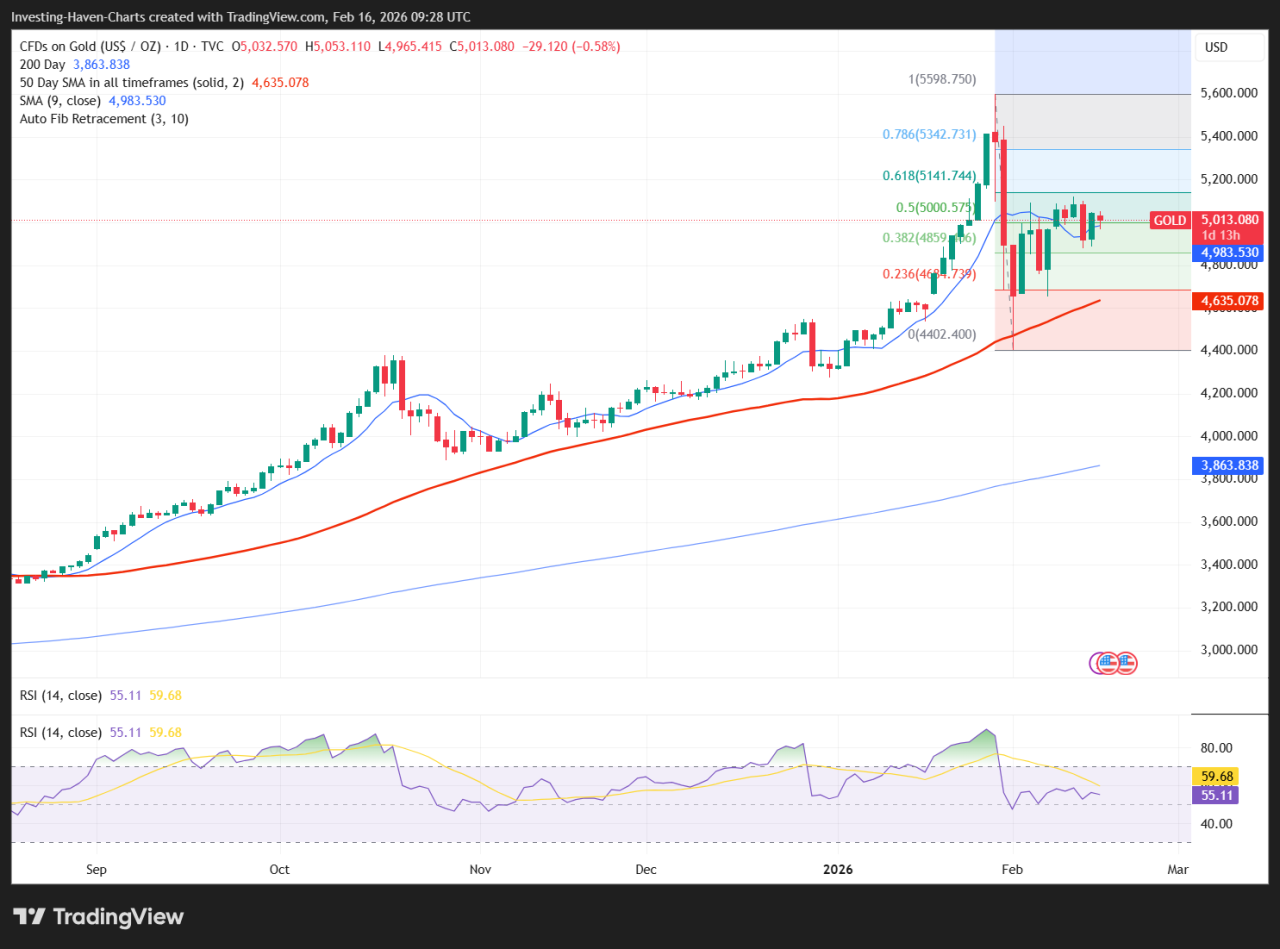
On February 17, Gold traded around $4,951 with April futures at $5,017 Earlier in the session, prices fell more than 1% before stabilizing inside the $4,950-$5,000 range.
Trading conditions were unusually thin as U.S. markets closed for Presidents’ Day on the 16th and parts of Asia observed holidays, according to AP.
When liquidity drops, small orders can move price faster and farther than usual. That is exactly what we are seeing now. Gold is not collapsing, but it is sitting on a level that traders clearly respect.
RECOMMENDED: Why Central Banks, Falling Dollar & ETF Mania Could Push Gold To $6,000
Gold Price Today And Why Liquidity Is Low
Spot gold is trading around $5,000 after a sharp intraday dip. In a normal session, that type of move might not raise eyebrows. In a thin session, it carries more weight.
Holiday closures reduce participation from banks, institutions, and large funds. With fewer orders sitting in the book, price can jump or fall quickly. Commentary from TradingView shows traders noting wider spreads and quicker spikes than usual. That does not automatically signal weakness but it means the market has less depth.
In this environment, one large order can trigger stops and exaggerate a move. That is why the $4,950 level feels fragile even though it has not broken decisively.
ALSO READ: JP Morgan Says Gold To Hit $6,300 By Year-End: Is Fiat Finished?
Why $4,950-$5,000 Is A Key Support Level
The $5,000 mark is a psychological level because round numbers attract attention. Traders place take-profit orders, hedge positions, and set stops around them. Just below it, $4,950 aligns with recent intraday lows and a visible consolidation area from last week.
Technical analysis from FXLeaders outlines a setup where buyers have stepped in around $4,950, with downside risk increasing below roughly $4,930 and upside targets around $5,100 to $5,120.
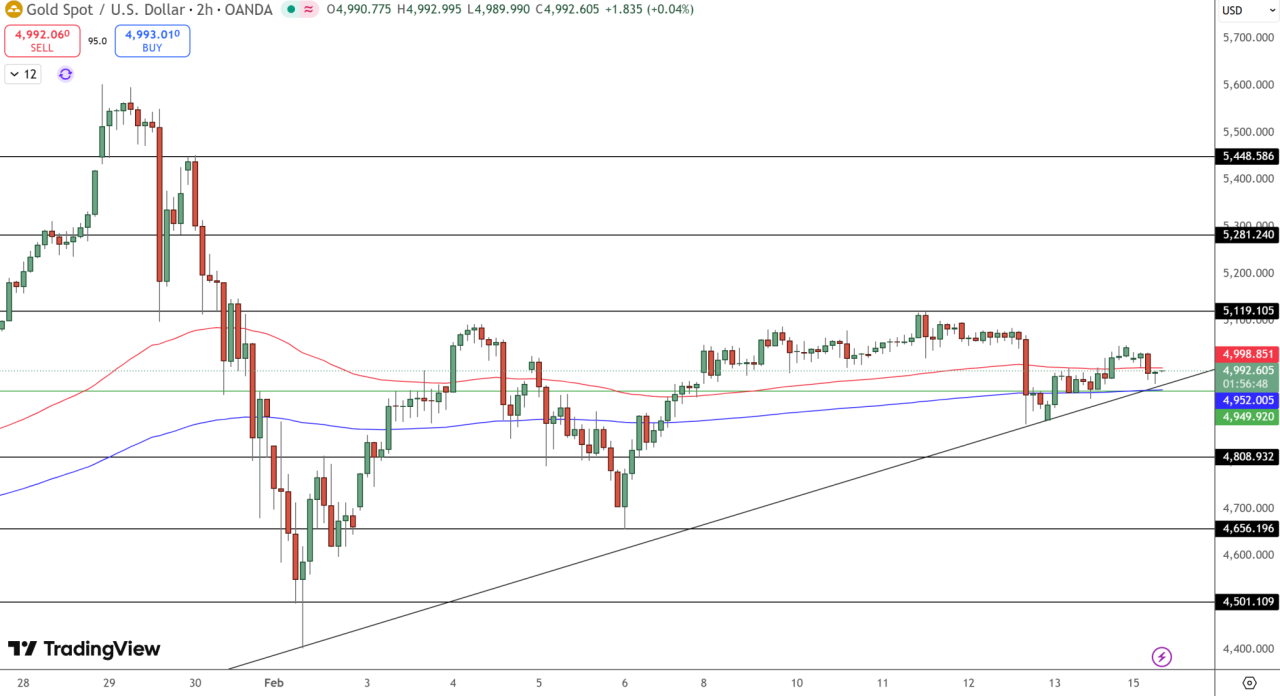
This tells you two things. First, buyers see value around this band. Second, stops likely sit just under it.
When support levels cluster like this, they can hold firmly. But if price slips through and triggers stops, selling can accelerate quickly. In thin markets, that acceleration can feel dramatic.
What Could Push Gold Above Or Below This Zone
For gold to break lower in a meaningful way, it likely needs more than just light holiday selling. It would take fresh macro pressure.
This week’s U.S. data, especially inflation or labor numbers, could shift rate expectations. If yields rise sharply, gold could face pressure. On the other hand, softer data would support the metal by easing rate fears.
ETF flows might also influence price. Large outflows signal institutional selling, which can weigh on price. Stable or positive flows would support the floor.
Geopolitical headlines can also reverse intraday weakness. Gold still acts as a safe-haven asset. In low-liquidity sessions, sudden risk-off buying can lift prices quickly.
In short, data and flows will decide whether this is just noise or the start of a deeper pullback.
RECOMMENDED: Gold Heading Towards $6,000/oz? Deutsche Bank Believes It Is
How Traders And Investors Can Approach It
Short-term traders should stay disciplined. A confirmed bounce from $4,950 offers a defined setup, with tight risk control below $4,930 and upside potential toward $5,100 or higher. Position size should stay modest because spreads are wider and volatility can spike without warning.
Longer-term investors may prefer patience. Thin sessions often produce false breaks that reverse once liquidity returns. Waiting for confirmation after markets fully reopen will reduce unnecessary risk.
Generally, respect the level, but do not overreact to every tick during low-volume trading.
Conclusion
Gold’s $4,950-$5,000 zone is holding for now, supported by recent structure and buyer interest. But thin holiday liquidity makes that support vulnerable to sharp, short-lived swings. A decisive move will likely come when full market participation returns and fresh economic data forces a clear direction.
Looking for clarity in the gold & silver markets?
Our premium members already have it.
InvestingHaven’s Gold & Silver Premium Alert Service delivers clear, data-driven forecasts built on nearly 20 years of precious metals expertise.
What you get:
Weekly gold & silver trend analysis using leading indicators (CoT, USD, yields, COMEX data).
Turning-point forecasting across multi-timeframe charts.
Actionable insights on GDX, GDXJ, SIL, and SILJ.
Intra-week alerts only when markets move — no noise.
Designed for serious investors who want medium- to long-term guidance, not short-term trading hype.
Join today and get the gold & silver roadmap trusted by disciplined investors worldwide.
Read our latest premium alerts:
- Wild Volatility Is Hitting Precious Metals. Here is How To Deal With It.(Feb 2nd)
- The Biggest Silver Sell-Off In 50 Years(Jan 31st)
- Gold to Silver Ratio at 50. Ready for Rotation? (Jan 25th)
- Time To Take Profits? (Jan 17th)
- Why January 2026 Is An Unusually Important Month for Precious Metals(Jan 10th)


