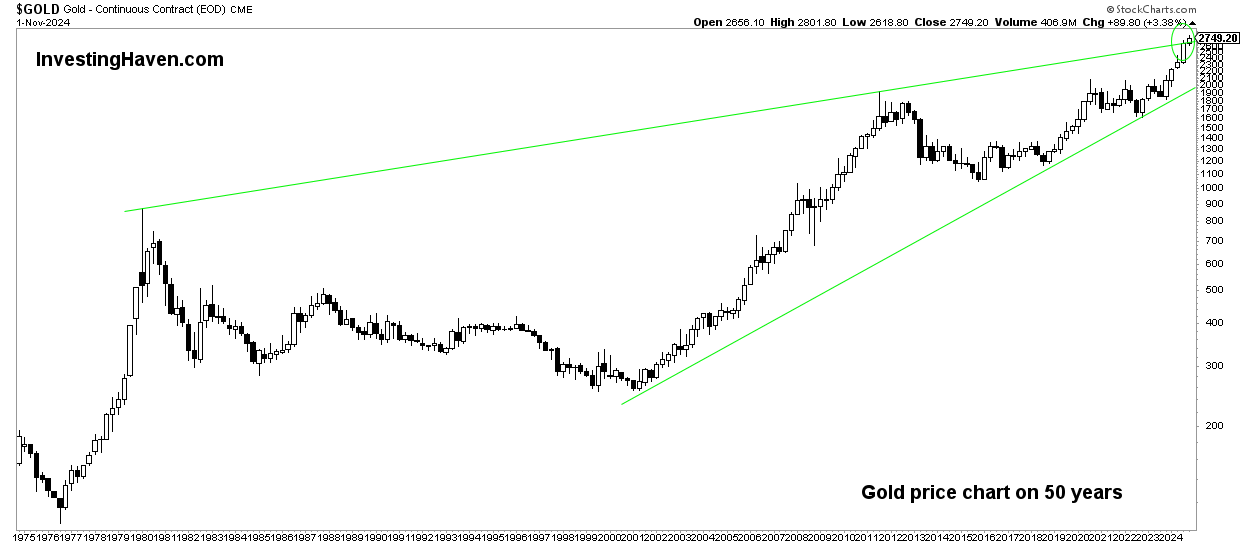
This quarter is crucial for gold. That’s because a chart pattern with an incredible length of 44 years is showing up on the gold price chart.
RELATED – Gold price forecast 2025
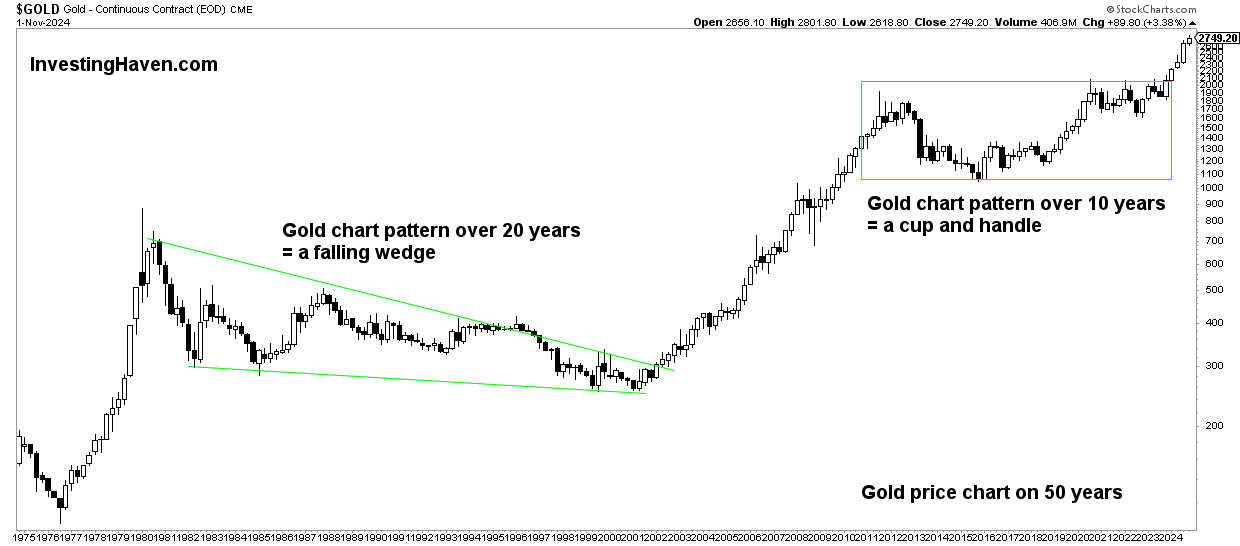
We discuss two chart views of the same 50-year gold price chart: one has a potential bearish implication but it’s offset by a bullish setup. That’s why this quarter is crucial for gold’s future.
Gold price alert – the wedge of 44 years
Below is the gold chart over 50 years connecting a trendline with the 1980 2011 highs.
A few simple observations, though crucial:
- It’s a quarterly candlestick chart – so whatever we derive from this chart should apply to quarters.
- Chart-wise, at present day (with 2 months to go in this quarter), this setup qualifies as a rising wedge which is a bearish setup.
- Can this rising wedge turn bullish? Yes, if both conditions will be met (a) the gold price does not stop rising here (b) the gold price does not print an intra-quarter turning point and a huge wick like in Q1/1980 and Q3/20211.
What we are saying is that the two previous tops, in 1980 and 2011, left a huge wick on the quarterly candlesticks. For this 44-year wedge to become bullish (not bearish), we need a quarterly closing price above the long term rising trendline (certainly no wick).
Gold price alert – If gold closes (well) above $2650 on December 31st, 2024, it will negate the bearish power of this long term rising wedge.

Gold – the secular bullish breakout
We now take the exact same gold price chart but look at it in very different terms:
- The 10-year gold price consolidation between 2013 and 2023 – a bullish cup and handle pattern.
- The long term gold price chart has 3 bull markets: 1977-1980, 2002-2011, 2024 onward.
It would not be reasonable to expect a top, three quarters after the start of a gold bull market that was the result of a 10-year price consolidation and bullish cup and handle pattern.
Gold price alert – The gold bull market just got started, there is lots of upside potential from this chart pattern. New ATH in gold can be expected with a higher probability than a lasting top.

Gold price alert – conclusion
Gold may certainly retrace.
However, a steep drop heading into Dec 31st, 2024, to turn the 44-year wedge into a wildly bearish pattern, is a very low probability outcome.
Gold price fundamentals are strong:
- The 10-year bullish cup and handle pattern is very sold.
- Gold made new ATH in 2024, which didn’t happen since 2011.
- Central banks are on a path to lower rates, good for gold.
- TIP ETH which we consider THE most important leading indicator for gold is supportive as long as it remains above 104-105 points.
- There is a buying spree in the gold market, now finally also hitting the Western investor world (lagging even though gold kept on making new ATH in 2024)
In sum, we are not concerned, but we remain sharp on the conditions for gold to remain bullish.
Gold price alert – The conclusion is simple: in case gold moves higher, it may accelerate its move higher and its bull market. That’s the opposite of the ‘bearish rising wedge thesis.’ So, whatever happens this quarter (combined with confirmation in the next 2 quarters with quarter closing prices are critical conditions) is the only thing that matters for the long term gold bull market.
At InvestingHaven.com, we stick to our bullish gold forecast for 2025 & beyond, until proven otherwise or until a blow-off top is set.


