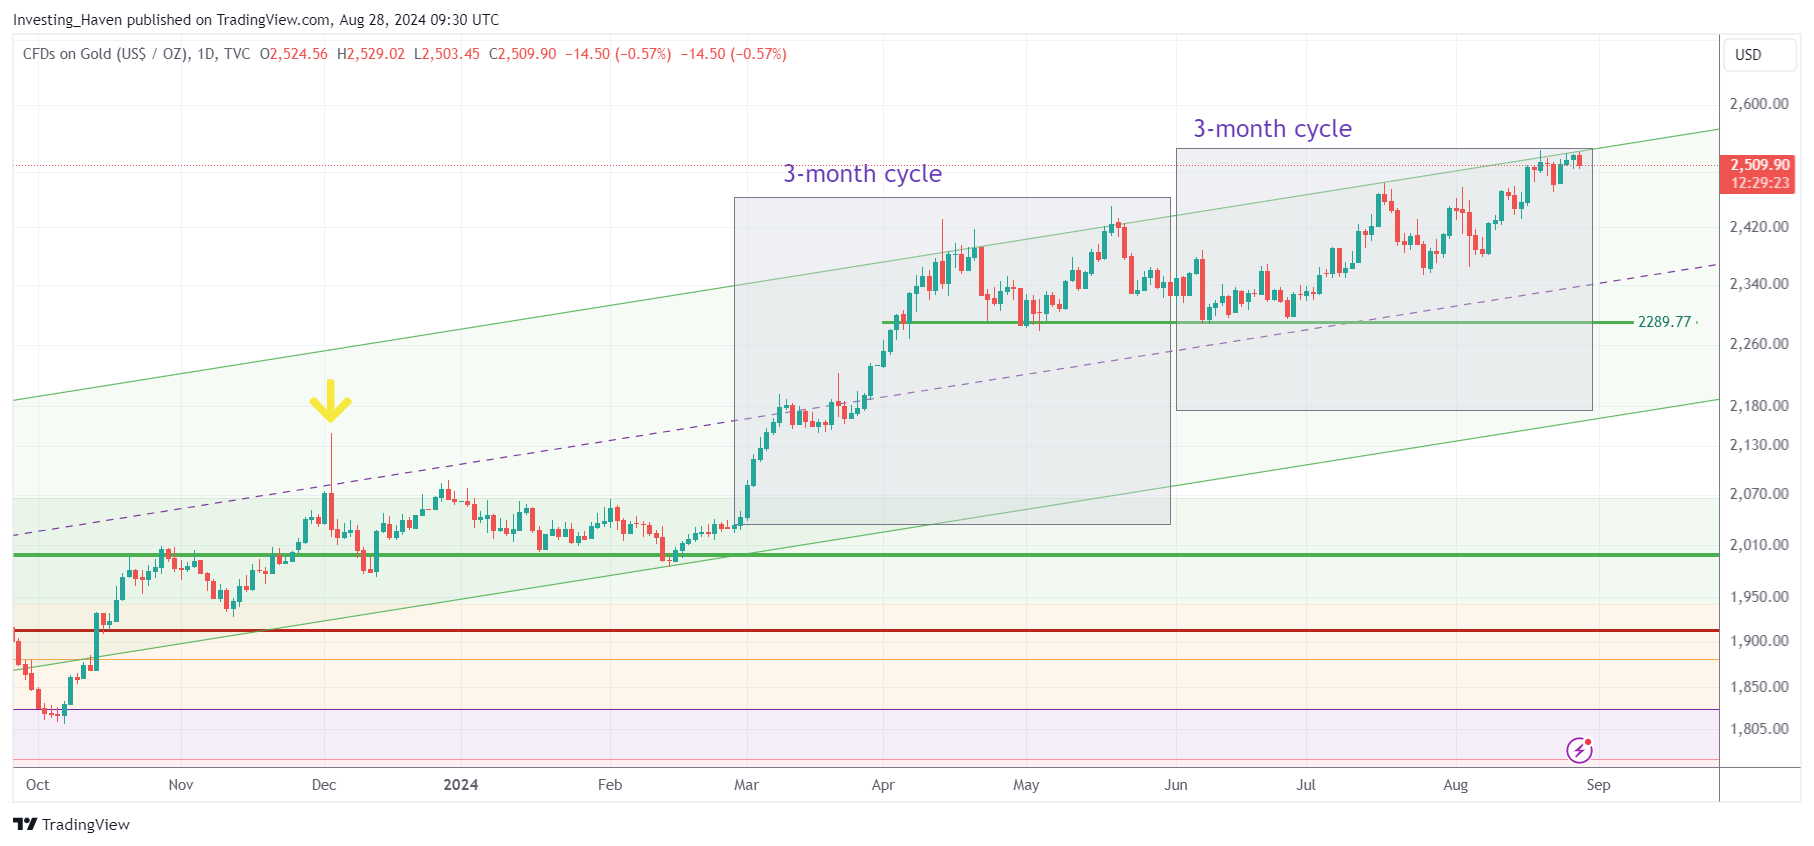
Gold continues to set new all-time highs. Gold is in a soft uptrend, and might continue to trend higher in September of 2024 provided it respects a soft uptrend during the first 10 days. This is why.
RELATED – A Gold Price Prediction for 2024 2025 2026 – 2030.
Note that we continue to associate gold with either a fear asset or a monetary inflation asset or both.
This is in shrill contrast with the majority of writers who believe that gold performs well in a recessionary environment – we never found evidence of this correlation.
Gold is a hedge in 2024
As correctly laid out by the World Bank, a few months ago, in their piece Gold shines amid geopolitical uncertainties:
Stronger gold demand from emerging markets and developing economies (EMDEs), amid heightened geopolitical uncertainty, is a key upside price risk.
Indeed, geopolitical tensions are certainly a catalyst for gold bullion.
However, we would add to this, as laid out in the intro, that an expected rise in real inflation (inflation minus expected rates set by central banks) is also on the rise.
Therefore, this environment is a great fit for gold as both catalysts are highly ‘gold friendly‘.
Gold chart in September 2024
The above mentioned catalysts are reflected on the gold price chart.
As seen, gold is in a soft uptrend.
It is important to emphasize ‘soft’ especially because of gold’s chart pattern. As seen on below chart, gold is rising along with its rising channel.
Gold is about to start a new 3-month cycle (September – November). Our gold research indicates that the first 10 days of each new cycle reveal critical price information. For instance, when the previous cycle ended, we predicted silver not to rise in the period June-August because the chart structure at the start of the new cycle was unlikely to be bullish.
Our expectation is that gold will continue to softly rise, in the first 10 days of September. If materialized, we can expect a bullish bias in the coming 3-month cycle.

Gold soft uptrend – sustainable or not?
In order to answer the question whether the ongoing gold uptrend is sustainable or not, we need to zoom out:
- 100 Year Gold Price Historical Chart
- Gold Price Chart Of 50 Years
- 10 Year Gold Price Chart *Bullish Chart Pattern*
Always take a top-down approach to assess trends.
The secular charts mentioned above consistently show secular breakouts. Those type of breakouts tend to last.
From a different perspective, looking at gold’s support structure in the period 2022-2023, the pattern created during this period is very solid.
When combined with the catalysts mentioned above (real rates rising and geopolitical tensions) we believe that everything is lined up for gold to continue its soft uptrend irrespective of temporary drops in the price of gold.
Sign up to receive our weekly gold & silver alerts >>


