
Gold price seasonality remains consistent and reliable. September is typically the weakest month, and as of mid-September 2024, we are transitioning into the strongest period for gold. This marks a prime opportunity for investors in 2024 as gold’s most favorable season begins.
READ – 2025 gold price prediction.
Understanding gold’s seasonality trends provides valuable insights for investors aiming to optimize their entry and exit points in the gold market.
By examining various timeframes—from the last 5 years to a 50-year historical perspective—we can identify consistent patterns, seasonal strengths, and periods of caution.
This articles explores gold seasonality trends using several charts, covering short-term, mid-term, and long-term data. One benchmark we’ll include is the comparison with silver price seasonality.
We also highlight the specific performance of the first part of each year.
December 15th – As the gold market heads into 2025, we see some consistent gold seasonality patterns over a long period of time and in recent years. Especially April tends to be a strong month, while January was consistently a good month for gold until 2020 (when the % occurrences started coming down).
Gold price seasonality: high level insights
Gold, as a valuable commodity and investment, has well-established seasonal patterns that can guide investors in making informed decisions.
A 50-year analysis reveals that gold typically experiences its strongest gains in the second half of the year, starting from July 6 and peaking around February 21 of the following year.
Credits to Seasonax founder Dimitri Speck (follow on X).
This period has historically offered average gains of 6.96% to 11.27%, significantly outperforming the average annual gain of 5.18% over 50 years.
RELATED – Gold Price Chart Of 50 Years
However, the first half of the year is less consistent, with periods of both strength and weakness. September, in particular, emerges as a challenging month, often being the weakest for gold, marked by lower performance and increased volatility.
When we examine the last 5 years (2020-2024), we see these long-term patterns reflected and reinforced, particularly the strength from October through February.
However, the 5-year data shows variability in months like March and April, contrasting with some of the mid-year trends seen in the 50-year analysis. This comparison highlights both the reliability and the nuances of gold’s seasonal trends, providing a roadmap for gold investments throughout the year.
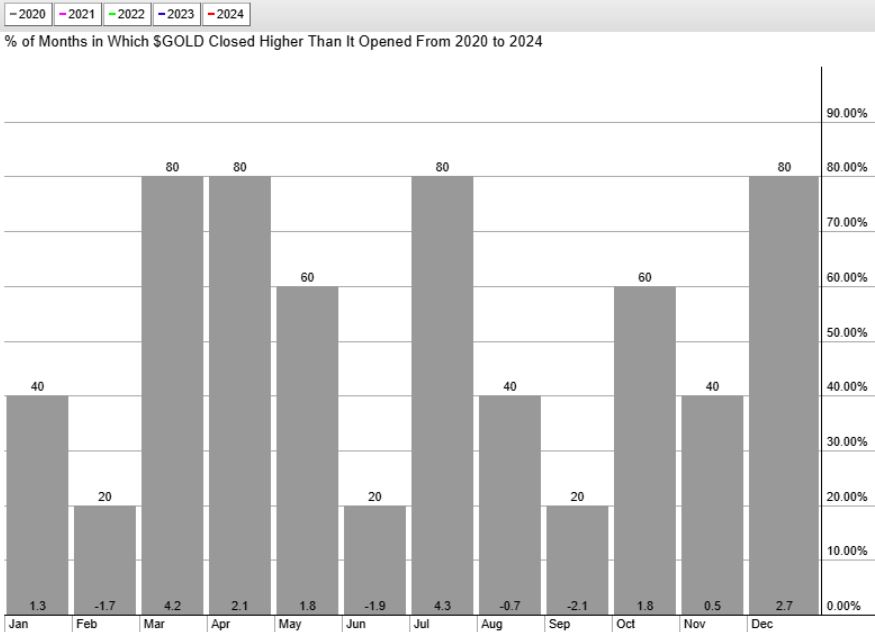
Gold price seasonality in the last 5 years: 2020-2024
This chart shows the monthly performance of gold from 2020 to 2024, highlighting the percentage of months when gold closed higher than it opened.
- Strong performance in March and April: The data shows consistent peaks in March and April, suggesting that these months have been favorable for gold investors in recent years.
- Mid-year weakness in June: Typically, June tends to show relatively weaker performance, indicating potential periods of consolidation or gold corrections.
- Strong in October and December: The months of November and December also display strong performance, pointing to favorable end-of-year conditions for gold.
Key insights: The recent 5-year trend highlights March, April, July, and December as strong months for potential gains in gold, while February, June, and September show more variability and caution is advised.
December 15th – The chart is updated with the latest data. 2024 was an atypical year when it comes to seasonality, especially September, November, and December (so far).
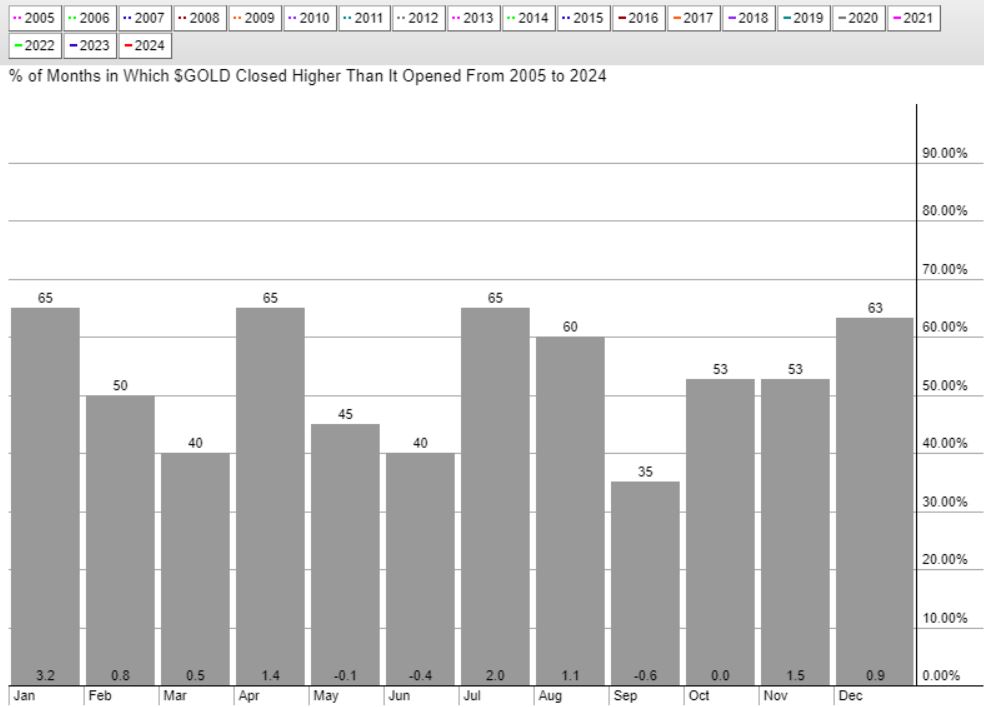
Gold price seasonality in the last 20 years: 2005-2024
This chart covers a 20-year period from 2005 to 2024, providing a longer-term perspective on gold’s seasonality.
- Consistently strong months – January, August, and November: Similar to the recent 5-year data, January, August, and November remain strong months, showing a higher probability of positive returns.
- Weakness in February and March: February and March have lower probabilities of positive returns, indicating these months could face seasonal headwinds.
- Mid-year Stability and late-year strength: The period from April to July shows more stability without significant peaks or troughs, while the end of the year (November and December) remains strong.
Key insights: The 20-year trend aligns with recent data, highlighting January, August, and November as key months for potential gains. It also reinforces the need to be cautious in February and March, where historical performance has been weaker.
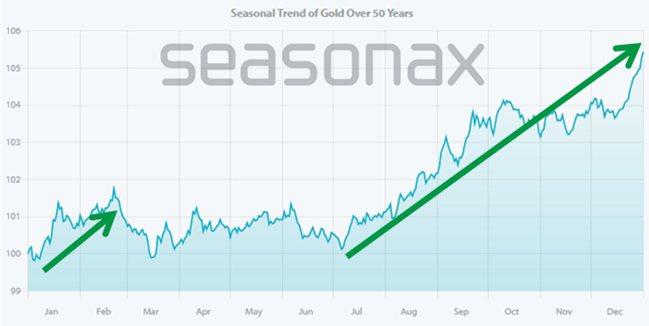
Gold price seasonality over 50 years
The 50-year seasonality chart from Seasonax.com provides a comprehensive historical analysis of gold prices throughout the year.
- Early year strength: Gold tends to perform well in January and February, indicating strong seasonality in the first quarter.
- Mid-year fluctuations: After a strong start, gold prices tend to fluctuate from March through July, showing a mix of moderate gains and some periods of weakness. As highlighted by Seasonax, there is generally no significant average return for investors before July 6.
- Precise timing of the seasonal rise: According to Seasonax, the most notable seasonal rise begins on July 6 and continues to a seasonal high on February 21 of the following year. During this period, gold’s gains have averaged 6.96% and 11.27% annually, which is more than double the average annual gain of 5.18% over the 50 years.
- September as the weakest month: September stands out as one of the weakest months for gold historically, often showing lower performance and increased volatility. This suggests that investors should exercise caution during this time.
- Late-year rally: From August onwards, especially in November and December, gold tends to rally, making the end of the year a consistently favorable period for gold investors.
Key insights: The 50-year trend confirms the strength in January, August, and November, aligning with shorter-term data. The period July 6 to February 21 highlights the most profitable timeframe for gold investors.
Gold price seasonality last 5 years vs. previous periods
Performance shifts in key months
- Consistent strong months – January, August, and November: Across all timeframes—5 years, 20 years, and 50 years—January, August, and November consistently emerge as strong months for gold. This consistency suggests these months are driven by recurring factors, such as increased investment demand, economic cycles, or geopolitical influences. Seasonax’s insight on the specific start of a strong period from July 6 reinforces that this trend is well-rooted in historical data.
- Weaker performance in February and March: Both the 20-year and 50-year data show February and March as weaker months for gold, which aligns with the recent 5-year trend. This consistency indicates these months may face seasonal headwinds, possibly due to market corrections or shifting investor sentiment.
Mid-Year fluctuations
- April to July stability: The data across all periods shows a relatively stable but less bullish performance from April to July. This period lacks the strong uptrends seen in other months, suggesting that investors might see this period as a time for consolidation or less aggressive trading.
- Late-year rally consistency: The strong performance in November and December across all periods highlights a reliable end-of-year rally, which could be attributed to market adjustments, geopolitical tensions, or shifts in monetary policy favoring gold as a safe-haven asset.
Gold vs. Silver seasonality over the long term
- Early year strength: Both gold and silver show strong performance in the early months (January to February). However, gold tends to maintain strength into March, whereas silver usually peaks earlier.
- Mid-year weakness: Both metals display mid-year weakness or variability (March to July for gold, June for silver), suggesting they are influenced by similar seasonal factors such as investor repositioning or broader economic cycles.
- Late-year strength: Both metals exhibit a late-year rally, with gold showing strong performance in November and December, while silver also shows positive trends during these months. This commonality suggests that end-of-year factors, like portfolio rebalancing or safe-haven buying, impact both metals similarly.
Key take-aways: gold seasonality, short & long term
- Consistent seasonal patterns: Across all timeframes, January, summer, and December stand out as strong months for gold, indicating reliable opportunities for gains.
- September as the worst month for Gold: Historically, September is often one of the worst months for gold, marked by lower performance and increased volatility. This trend suggests that September can be a challenging period for gold investors.
- Periods of caution: While September is notably weak, other months like February also show underperformance. Similarly, mid-year (April and May) is marked by stability but less aggressive gains.
December 15th – With 2025 coming up, we see that consistently strong periods of the years tend to be April, and to some degree also January. The month of March tends to be weak.
By understanding these gold seasonality trends and the timing of key periods like September and the post-September rally, traders and investors can better position in the gold market, optimizing entry and exit points to mitigate risks as much as possible.


