Since July 11th, 2024, the EUR is going through a secular breakout attempt. If successful, which may take weeks or even months, it will be wildly bullish for the price of gold.
RELATED – Will Gold Ever Hit $3,000 an Ounce?
With gold flat for some 4 months now, many start doubting where gold has peaked.
We firmly disagree with a topping scenario in gold, for many reasons in fact.
The most important reason is that gold’s long term chart is very bullish, especially the longer timeframe like the 50-year gold price chart. Even the 10-year gold chart looks very solid.
Gold is bullish on its highest timeframes. This implies that consolidations or sell-offs on the lower timeframes are creating noise more than anything else. As said many times, stay away from gold news, it’s confusing and misleading.
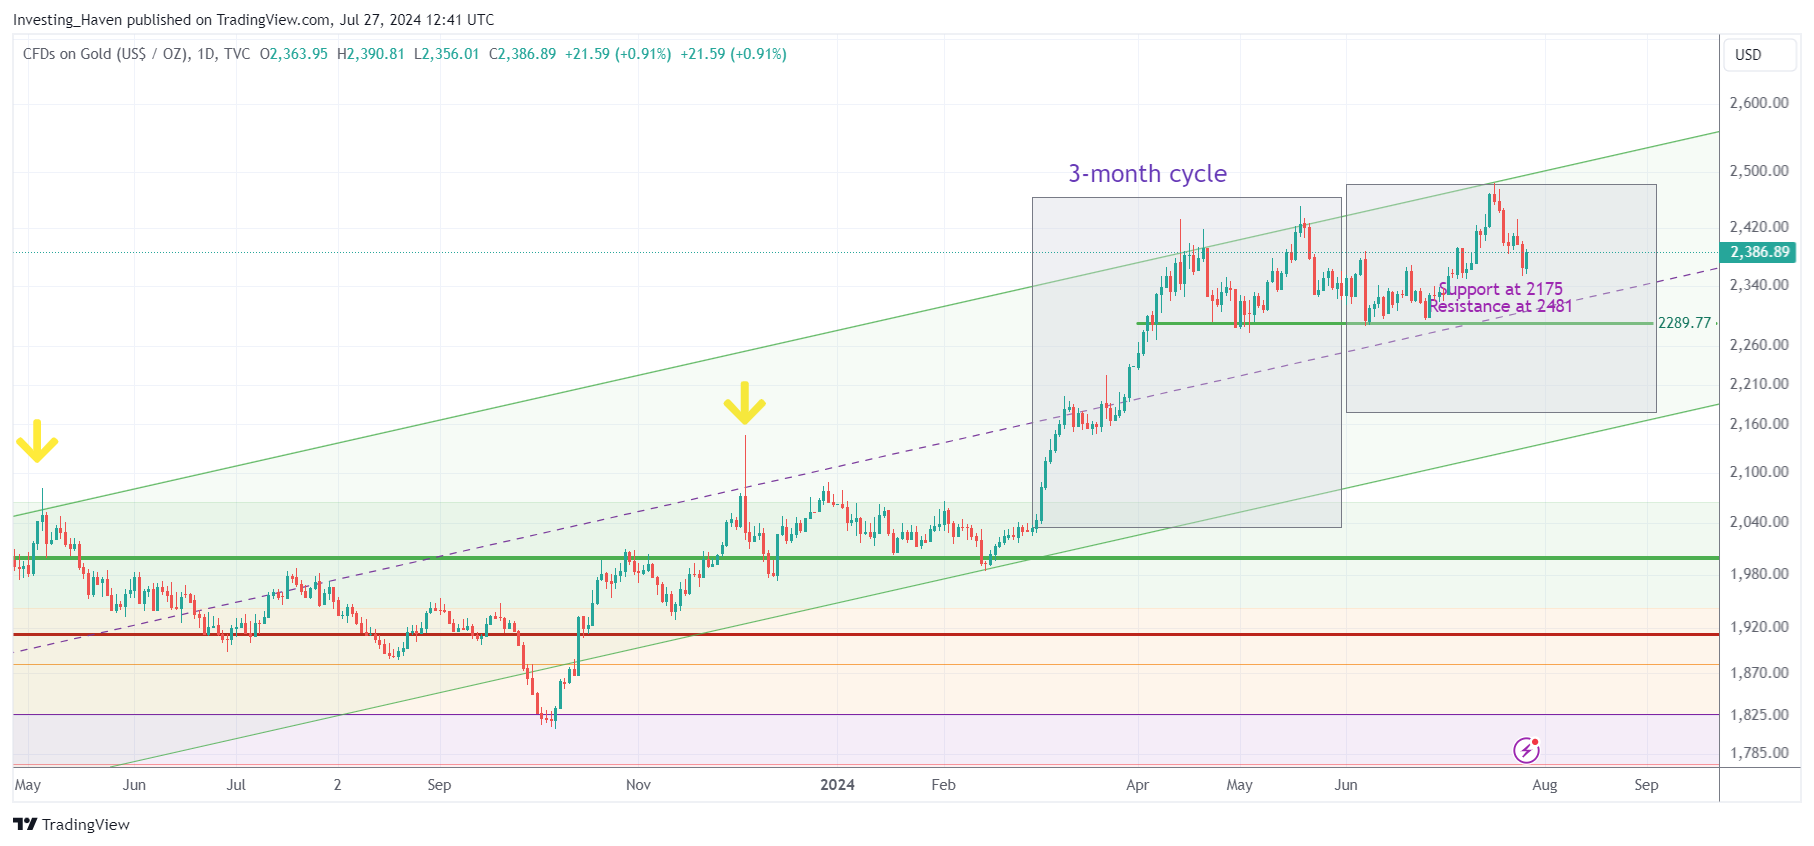
Gold price chart – a soft uptrend
If anything, the daily gold price chart (XAUUSD) is a beauty.
Yes, it hit resistance, recently, but that’s a short term view.
The one characteristic that stands out on gold’s chart – it’s an uptrend. The soft nature of this uptrend is not important because it’s an uptrend.
Gold leading indicator – a secular breakout attempt
One of gold’s leading indicators, as explained in our gold forecast, is the EURO.
The EURO is positively correlated with gold, because gold is inversely correlated to the USD.
RELATED – A Gold Price Prediction for 2024 2025 2026 – 2030.
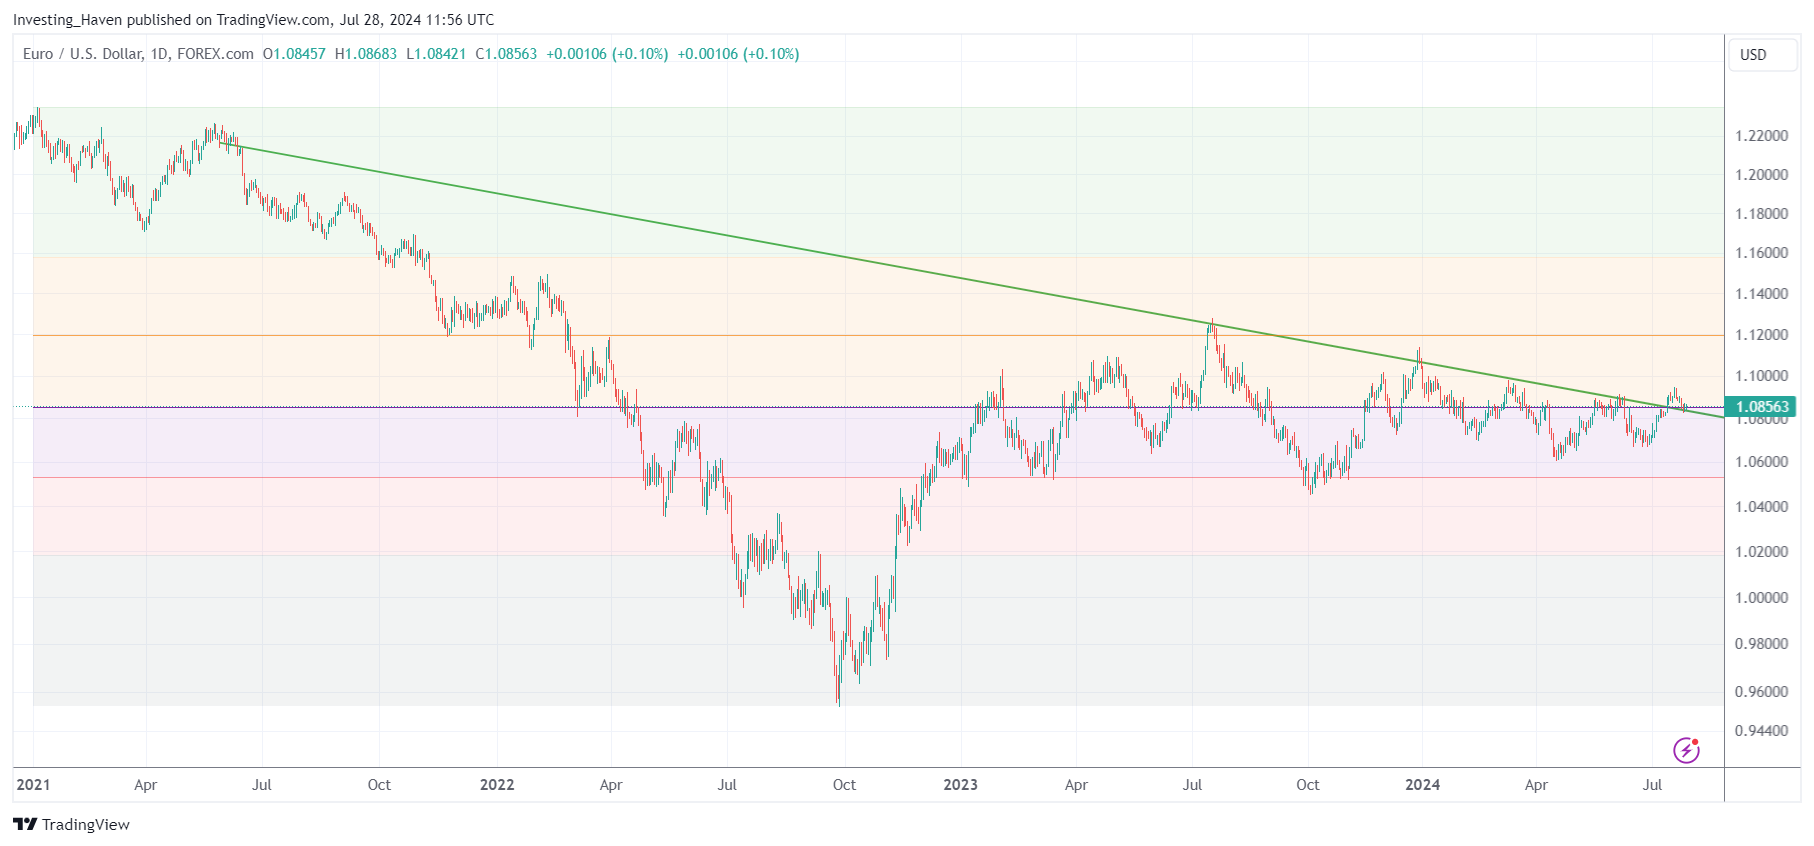
Below is a multi-year price chart of the EURUSD, with our annotations featuring (a) key Fibonacci levels (b) the most obvious falling trendline.
As seen, on July 11th, 2024, the EUR rose above both the falling trendline and the most critical Fibonacci level (the 50% retracement level). This is meaningful, very meaningful.
If the EURUSD continues to move higher, it will support the gold bull market thesis.
While the EURUSD can move lower in the short term, invalidating the breakout attempt that started on July 11th, 2024, it may be that the breakout will be postponed. So, we need to adopt a long term view on this EURUSD chart, even in case of a drop in this currency pair.
Gold leading indicator – speculators too bullish
On the flipside, there are way too many speculators on the long side in the gold market.
Below is the managed money index (aka speculators) with a high reading ‘long’ unfortunately.
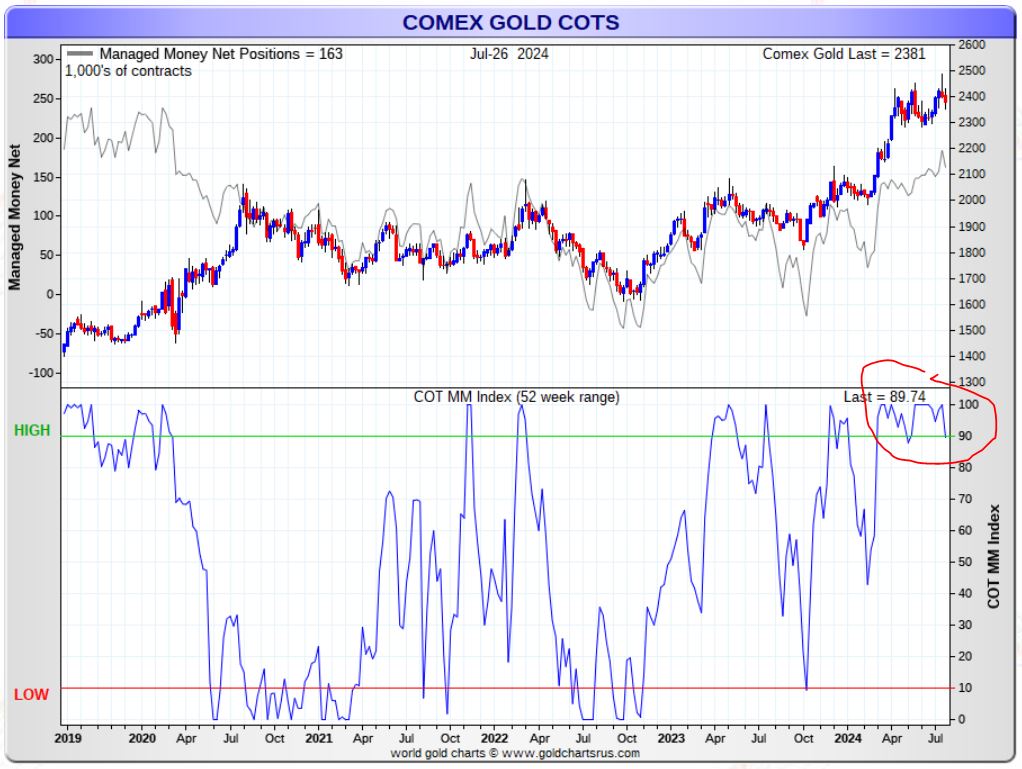
The gold price might need to drop a bit to scare away speculators.
Ideally, for the gold price to adopt a continued bullish trend, there are less speculators on the long side.
So, in order for gold bulls to be confident about gold’s long term bull market, we prefer to see a price drop in gold resulting in less speculators on the long side followed by an epic secular breakout in the EURUSD.
Both may happen in the period August to October 2024, is what our research is suggesting.
Read more in our latest gold & silver research reports >>


