Renewed central-bank buying tightens supply and creates steady price support. Official flow data and ETF holdings reveal the market direction.
Central banks have returned to steady gold purchases, and those buys now sit alongside strong ETF demand. This combination reduces available bullion and lifts prices, creating a different market than recent years.
RELATED: Central Banks and Long-Term Investors Fuel Gold’s Surge
Why Central Banks Have Returned To Buying
Many reserve managers have added gold this year to diversify holdings and increase reserve liquidity. Official reports show a rebound in central-bank buying, with a notable 15 tonnes of purchases recorded in August.
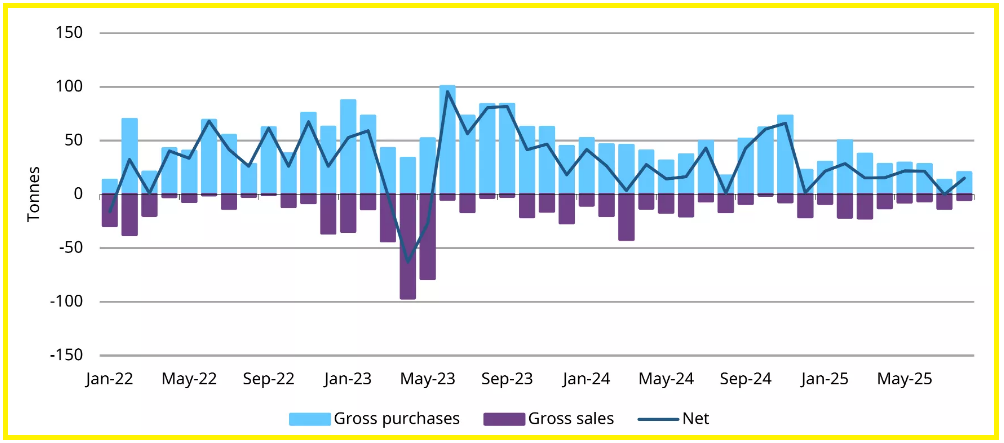
Analysts expect high annual totals for 2025, with institutional Gold price forecasts in the hundreds of tonnes, reflecting ongoing reserve accumulation.
RECOMMENDED: Smart Investors Are Buying Gold in 2025: 9 Must-Know Reasons
How Official Buying Changes Market Structure
Official purchases remove metal that would otherwise flow to traders or industry, tightening the physical market. Total global quarterly demand, including investment, reached 1,249 tonnes in Q2, a 3% increase year on year, showing how strong investment has become.
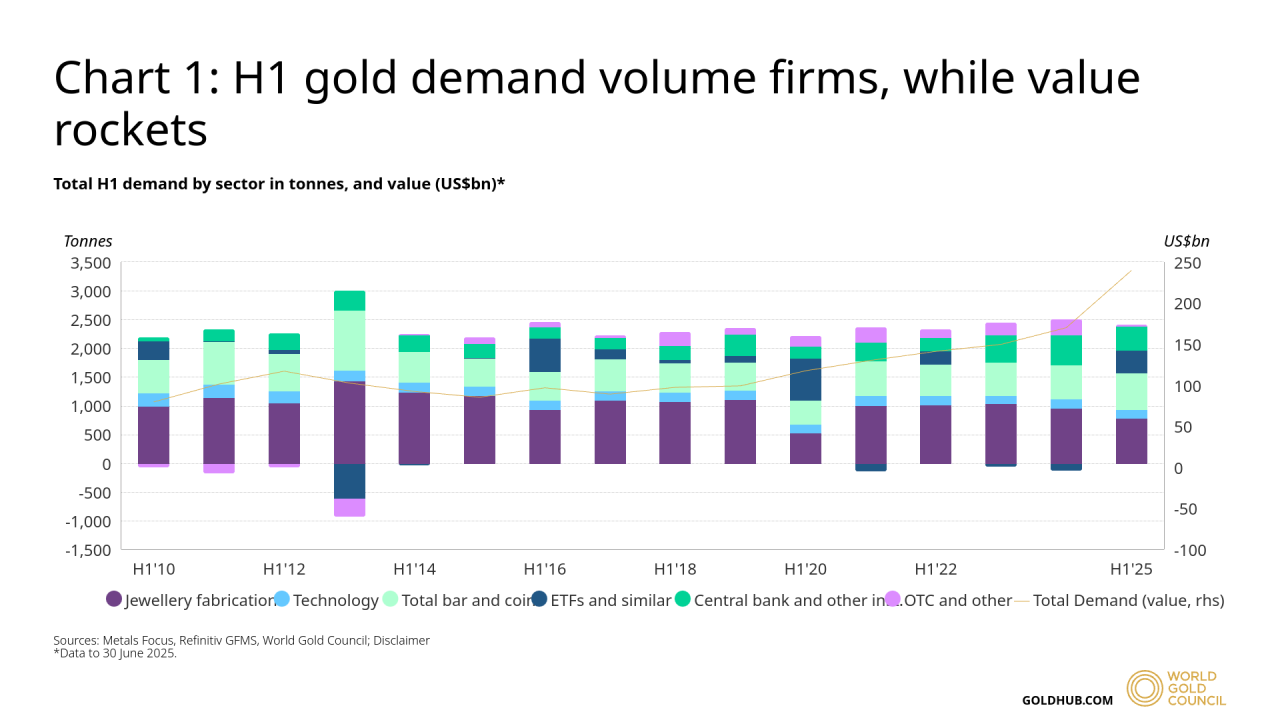
At the same time, ETFs added large amounts of metal, with 397.1 tonnes entering funds in the first half of the year, raising total ETF holdings and making paper and physical demand overlap more closely.
That overlap reduces slack in the market and can amplify price moves when flows accelerate.
RECOMMENDED: Ray Dalio Says Gold Will Rally Further As U.S. Debt Mounts
What Investors Should Watch
Track three items each month:
- Official flows
- ETF holdings
- Price behavior around key levels.
Official flow reports will show whether central banks keep buying each month. Gold ETF holdings and weekly flows will show whether investors continue to layer on to official demand.
Finally, watch price behavior around the $3,900 to $4,000 band, because sustained closes above that range would signal that structural demand has taken control.
RECOMMENDED: 2025 Treasury Moves Drive Safe-Haven Flows Into Gold and Silver
Conclusion
Central-bank Gold purchases have moved from an occasional factor to a steady source of demand. Follow monthly official flow data and ETF metrics to understand whether the market will stay tight and prices can hold higher levels.
61% of retail investor accounts lose money when trading CFDs with this provider. You should consider whether you can afford to take the high risk of losing your money.
When is The Best Time To Buy Gold & Silver?
To receive key alerts and analysis on the best times to buy Gold and Silver, you should consider Joining the original market-timing research service — delivering premium insights since 2017.
InvestingHaven alerts are powered by a proprietary 15‑indicator system refined over 15+ years of hands-on market experience.
This is the same service that accurately guided investors through stock market corrections and precious metals rallies.
Act now and discover why thousands rely on us for timely, actionable signals — before the market makes its move.
Here’s how we’re guiding our premium members (log in required):
- Will Silver Set a Major Top at $50/oz? Our Deepest Analysis Yet. (Sept 27)
- Silver Rally Fueled by Absent Speculators (Sept 20)
- What Happens When Silver Hits 50 USD/oz? (Sept 13)
- Monster Basing Patterns in Precious Metals Resolving Higher (Sept 6th)
- Must-See Monthly Gold & Silver Charts (Aug 31)
- The 5 Most Important Silver Charts For H2/2025 (Hint: Very Bullish) (Aug 23)
- Silver – Speculators Keep Exiting The Long Side. What Does It Mean? (Aug 16)


