Gold trades at fresh records. Key levels to watch: $3,750 to $3,800 for breakout, $3,620 to $3,600 for failure.
Gold sits at fresh record levels after heavy central bank purchases and large ETF inflows, while markets price in Fed rate cuts and lower real yields.
That combination concentrates positioning, so narrow technical bands now determine whether momentum extends or prices pull back.
ALSO READ: Ray Dalio Says Gold Will Rally Further As U.S. Debt Mounts
Immediate Technical Map: Supports & Resistances To Watch
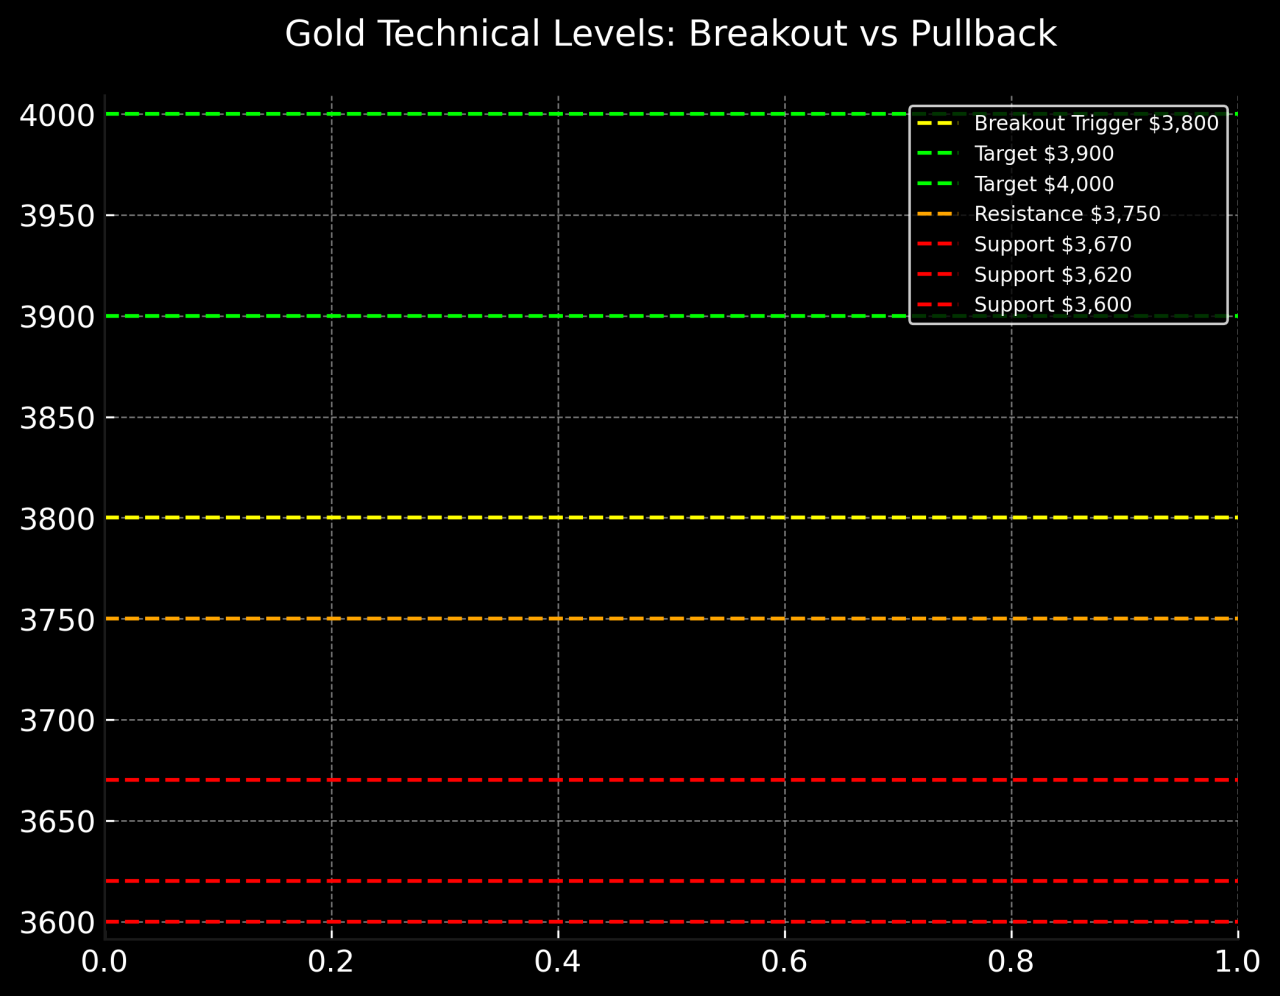
Based on our Gold technical analysis, the first barrier to clear is $3,750 to $3,800, a cluster of recent intraday highs and a psychological cap. If price holds above that band on a weekly close, traders treat that as a clean breakout.
Above that, analysts point to $3,820 to $3,900 as the next Gold price predictions used by momentum traders. On the downside, look for support between $3,670 and $3,620, with a more important shelf at $3,600.
A decisive break below $3,600 would change short-term risk preferences and invite deeper profit taking. These levels reflect recent technical writeups and intraday patterns.
RECOMMENDED: 5 Reasons to Buy Gold in 2025
What A Breakout Versus Pullback Would Imply
A decisive weekly close above $3,800 with strong volume and continued Gold ETF inflows would likely draw momentum buyers and open $3,900 to $4,000 targets cited by market commentators.
Watch headline ETF flows and GLD moves for confirmation. Conversely, a drop through $3,620 to $3,600 would likely be linked to a firmer dollar or rising real yields and should prompt short-term sellers to reduce positions.
Track weekly ETF holdings data and real-yield moves to validate either scenario.
RECOMMENDED: Want to Make $1M with Gold? Here’s How in 10 Years or Less
Indicator Checklist And Trade Plan
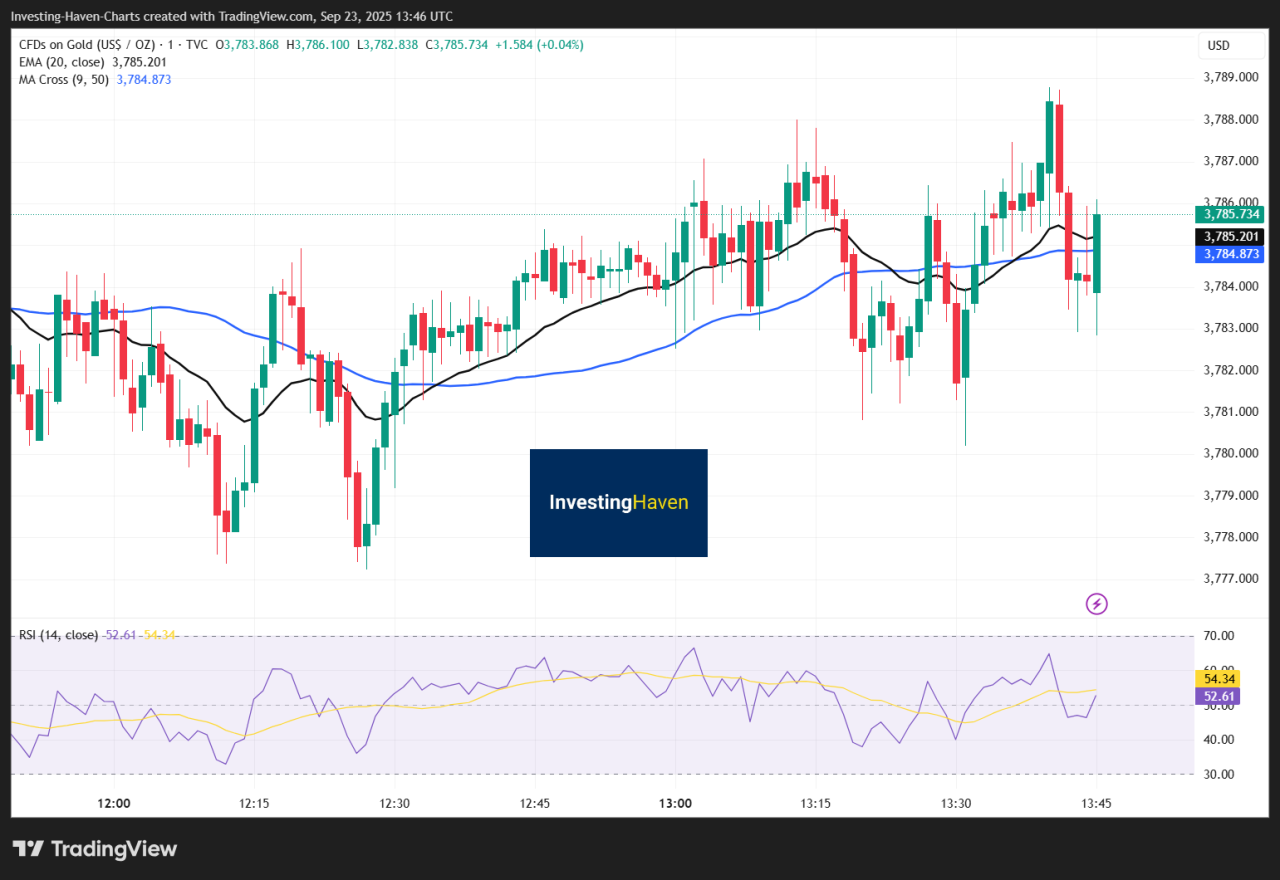
Check daily RSI for overbought signals, and the 50/200-day moving averages for dynamic support. Use ETF AUM and weekly flow headlines as flow confirmation.
Trade plan: buy dips into the $3,670 to $3,620 band, or scale into a breakout above $3,800 with a stop just under the breakout candle, and a clear 1:2 risk to reward.
RECOMMENDED: Why Gold Makes Sense for Long-Term Investors
Conclusion
Watch for a weekly close above $3,800 to signal strength, or a break below $3,620–$3,600 to warn of pullback. ETF flows and real yields should confirm the turn.
When is The Best Time To Buy Gold & Silver?
To receive key alerts and analysis on the best times to buy Gold and Silver, you should consider Joining the original market-timing research service — delivering premium insights since 2017.
InvestingHaven alerts are powered by a proprietary 15‑indicator system refined over 15+ years of hands-on market experience.
This is the same service that accurately guided investors through stock market corrections and precious metals rallies.
Act now and discover why thousands rely on us for timely, actionable signals — before the market makes its move.
Here’s how we’re guiding our premium members (log in required):
- Monster Basing Patterns in Precious Metals Resolving Higher (Sept 6th)
- Must-See Monthly Gold & Silver Charts (Aug 31)
- The 5 Most Important Silver Charts For H2/2025 (Hint: Very Bullish) (Aug 23)
- Silver – Speculators Keep Exiting The Long Side. What Does It Mean?(Aug 16)
- Must-See Secular Charts: Precious Metals Mining Breakout & More (Aug 9)
- The Monthly Silver Chart Looks Good + A Special Harmonic Setup On The EURUSD (Aug 2)


