
Gold trades near $3,379 on rate‑cut hopes after softer jobs data. It now moves inside a tightening triangle with signs of a breakout or stall.
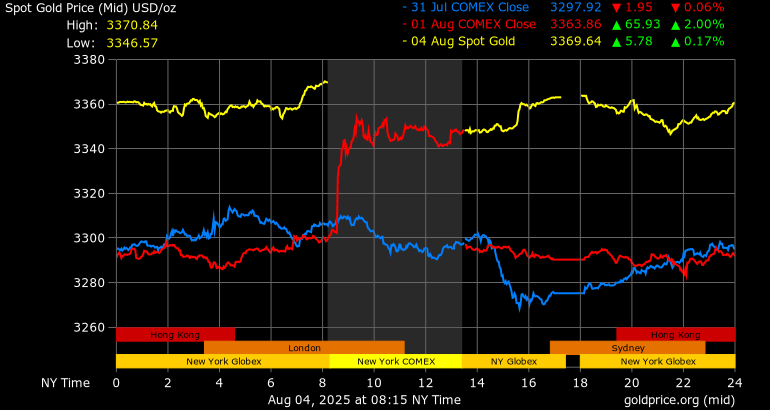
Spot gold sits at $3,369 per ounce after a roughly 1.8 percent gain last session on the U.S. jobs miss that showed just 73,000 new positions added in July. Traders now price in an 81 percent chance of a Fed rate cut in September.
The metal forms a symmetrical triangle between $3,300 support and $3,360–$3,372 resistance, setting the stage for a potential breakout or squeeze. The outlook now hinges on fresh U.S. data and policy signals.
Tightening Price Patterns: Triangle Near a Decisive Break
Gold has traded inside a narrowing triangle for weeks with lower highs pressed against $3,379 and higher lows near $3,300 support. A daily close above $3,380 could trigger upside momentum targeting $3,430 or more. If the price drops below $3,330, bulls may pull back toward $3,200. The gold triangle consolidation now signals a pivotal choice. Declining volume in recent days points to exhaustion inside the coil.
Macro Forces Boost Upside Targeting $3,500
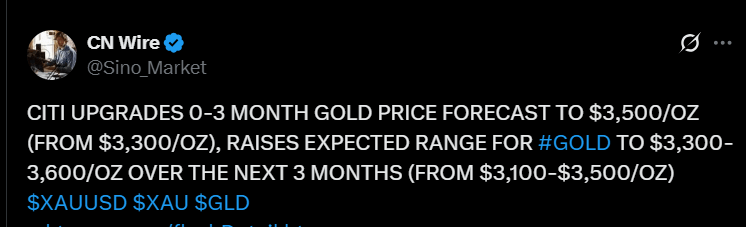
Citi just lifted its 3‑month gold price forecast to $3,500, expanding its expected trading band to $3,300–$3,600, citing worsening U.S. growth, tariffs, and a weak dollar.
Global gold demand rose 3 percent in Q2 to 1,248.8 tonnes, due to growing ETF inflows and central bank buying. Central bank gold buying now accounts for a third of total demand, reinforcing the structural case.
What to Watch This Week
You should watch U.S. CPI, PCE, and Powell commentary. Clear signals can tip the triangle one way.
A breakout above resistance would reinforce the case for a Fed rate cut and gold rally toward $3,430–$3,500. If the price falters at $3,360, the metal may trade within the $3,300 trading range until fresh catalysts shift sentiment.
Conclusion
Gold now sits at a potential turning point. You must watch whether it breaks gold breakout resistance above $3,372–$3,380. A confirmed move higher opens the path to $3,500. Failure could confine gold to the lower half of the triangle.
Best Gold Trading Platform for Intermediate Traders and Investors
Invest in gold and 3,000+ other assets including stocks and cryptocurrenncy.
0% commission on stocks - buy in bulk or just a fraction from as little as $10. Other fees apply. For more information, visit etoro.com/trading/fees.
Copy top-performing traders in real time, automatically.
eToro USA is registered with FINRA for securities trading.
30+ million
Users worldwide
Analyzing price, time, leading indicators
InvestingHaven’s premium trading service is intended to help investors who are interested in the gold & silver market.
We analyze multiple charts to understand price trends, bullish & bearish time windows, turning points. Moreover, we cover leading indicators for the gold & silver price. They help us understand current and future price trends.
RELATED: Premium Gold Investing Service
Our Latest Alerts:
- The Monthly Silver Chart Looks Good + A Special Harmonic Setup On The EURUSD (Aug 2)
- A Trendless Summer for Precious Metals? (July 26)
- Spot Silver in EUR Closes at Highest Weekly Level Ever (July 19)
- Silver Breakout Confirmed Now, Check These Stunning Silver Charts (July 12)
- The Two Only Silver Charts That Matter In 2025 (July 6)


