Gold faces pivotal moves this week as Fed minutes and the July 9 tariff deadline threaten to disrupt current technical support.
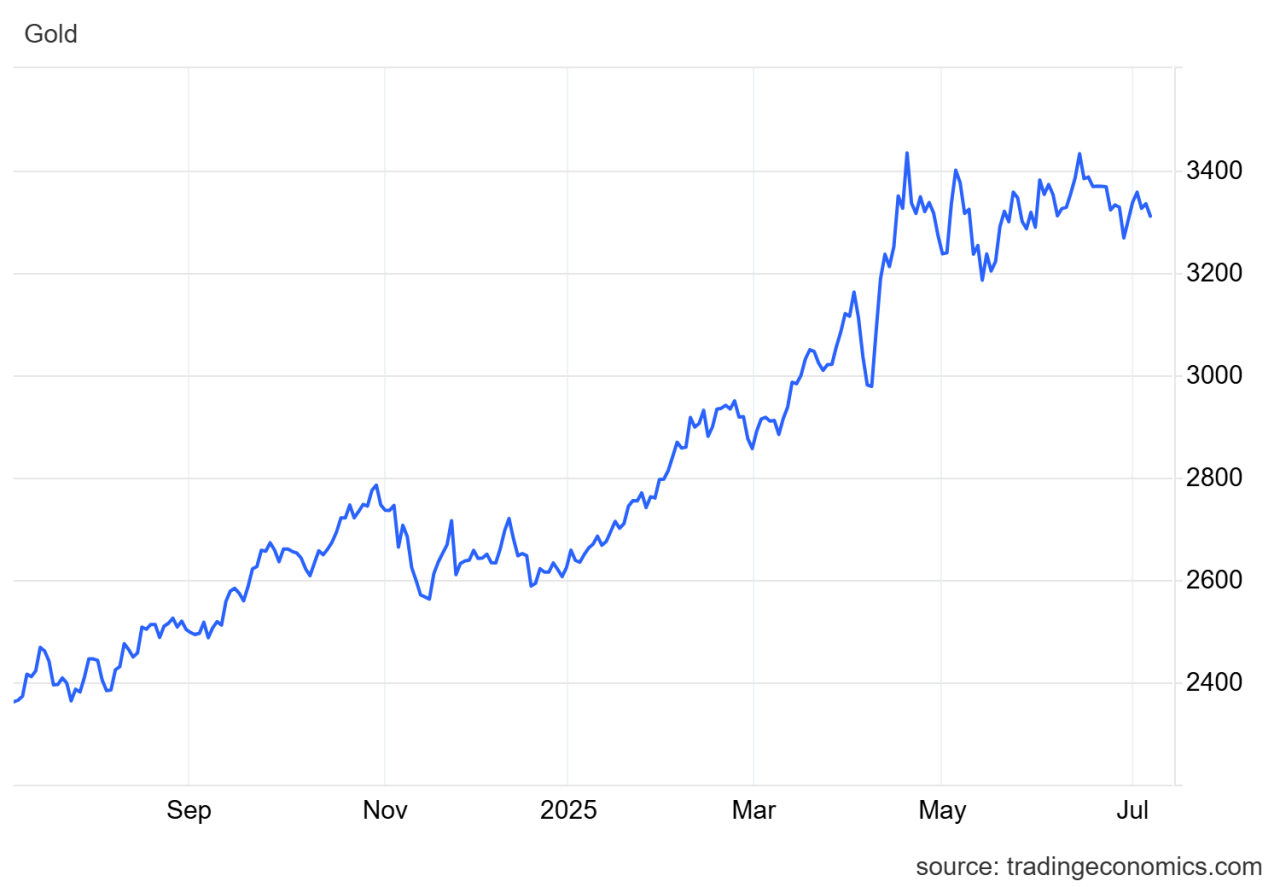
Gold enters this week a little fragile, having pulled back roughly 5% from its April peak near $3,500 per ounce. HSBC’s view that momentum is “fading” exposes a need for fresh catalysts.
Two key events—this week’s release of the June Federal Reserve minutes and the looming July 9 tariff deadline—are set to steer gold’s next move around the $3,300 mark
Federal Reserve Minutes: Dovish Cues or Delay Realities?
The Fed minutes are expected to elaborate on policy projections and inflation trends. Markets are speculating more on a September rate cut, not July, with futures pricing in only two quarter-point reductions by year-end.
Powell has emphasized a “wait-and-see” approach, particularly concerning tariffs’ impact on prices.
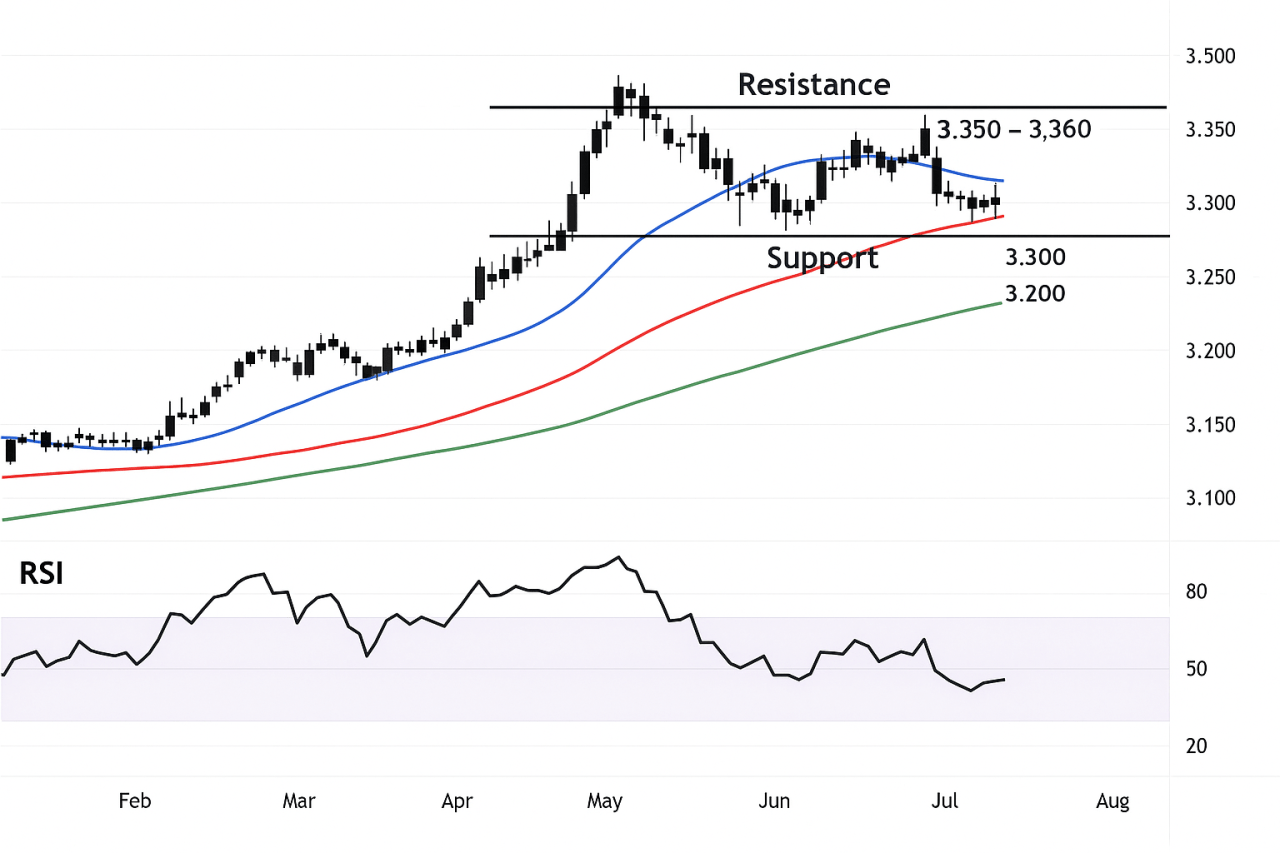
Key technical watchpoints: gold trading just below its 50‑day simple moving average at $3,311. A decisive break below could expose a slide toward $3,300 or even $3,248, while a dovish surprise might reenergize bulls.
Tariff Deadline & Trade Risk: Safe‑Haven or Relief Trades?
Uncertainty around the July 9 deadline for Trump’s 90‑day tariff reprieve is a key driver. As of July 1, spot gold rose 0.6% to $3,322.55 amid fears tariffs (10–50%) may be reinstated.
Conversely, fresh trade deals or an extension lifted gold to $3,311 on July 7, showing market sensitivity to Washington’s signals.
This means tariff developments in the coming days could be the wildcard—sparking either a safe-haven rally above $3,336 or a slide if a settlement is reached.
Technical Wrap & Key Levels For Gold
Gold remains tightly ranged between significant moving averages, with the RSI weakening, signaling consolidation. Expect resistance near $3,350–$3,360, and crucial support zones at $3,300 and $3,248 if bearish momentum resumes.
Gold Conclusion
Gold’s path this week hinges on two factors: whether the Fed minutes flag persistent inflation risks or tariff pressures, and how the July 9 trade deadline resolves.
Those will likely determine if gold breaks higher above $3,360 or slips toward the $3,300 basin. So, if you are looking to invest in gold, keep eyes on catalysts—and the charts—for a clearer signal.
Best Gold Trading Platform for Intermediate Traders and Investors
Invest in gold and 3,000+ other assets including stocks and cryptocurrenncy.
0% commission on stocks - buy in bulk or just a fraction from as little as $10. Other fees apply. For more information, visit etoro.com/trading/fees.
Copy top-performing traders in real time, automatically.
eToro USA is registered with FINRA for securities trading.
30+ million
Users worldwide
Our most recent alerts – instantly accessible
- The Two Only Silver Charts That Matter In 2025 (July 6)
- Quarterly Gold & Silver Charts Are In, Here’s the Big Picture (June 29)
- Gold & Silver – The Big Picture Charts That Matter (June 21)
- Gold & Silver Shine but Not Simultaneously… The Market Loves To Confuse Investors (June 15)
- Silver On Its Way To 50 USD/oz (June 8)
- Precious Metals: The Long-Term Outlook Looks Profitable, Here Is Why (May 31)
- [Must-Read] Spot Silver – This Is What The Charts Suggest (May 24)
Unlock Premium Market Insights


