KEY TAKEAWAYS
- Gold corrections of 10% to 20% occur frequently during strong rallies and often reverse when real yields or the dollar ease.
- Sustained rises in 10 year TIPS yields increase the opportunity cost of holding gold and apply short term downside pressure.
- Dollar strength compounds gold declines when it coincides with rising real yields, tightening global purchasing power.
- Large speculative positions and short-dated options can accelerate selloffs through forced unwinds and dealer hedging flows.
Gold price declines usually reflect real yields, dollar strength, positioning, and risk shifts, not a collapse in long-term demand or trend.
Gold price declines are rarely random. Most pullbacks come from structural forces like real interest rates, currency moves, positioning shifts, and changing risk sentiment; not from a sudden collapse in long-term demand.
If you understand these forces you’ll learn to avoid panic-driven decisions and view gold through a longer market cycle.
Gold has historically moved in waves rather than straight lines. Even during powerful bull markets, corrections and consolidations are normal. Sharp pullbacks often occur after strong rallies, when macro conditions temporarily shift or speculative positioning becomes crowded.
These periods can feel dramatic in real time, but they are usually part of broader trend behavior.
So, to understand why gold is dropping, avoid predicting every short-term move and focus on recognizing recurring patterns. This will help you distinguish between structural weakness and healthy market resets.
RECOMMENDED: Can Gold Drop to $4,000? Why the 15% Sell-Off Might Not Be Over
Why Gold Drops
Gold drops for repeatable, observable reasons tied to rates, currency moves, positioning, and risk behavior. These declines usually reflect shifts in financial conditions, not random selling or a sudden loss of long-term demand.
Below are the core forces that explain why gold price falls, even inside strong gold trends.
Rising Treasury Yields And Real Interest Rates
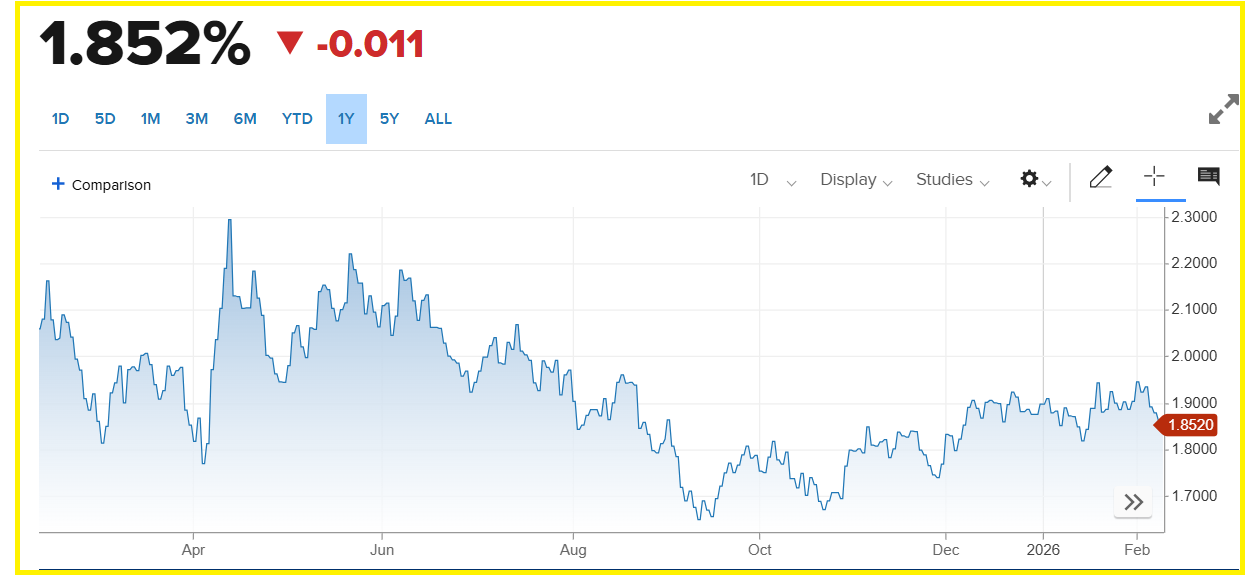
Gold does not generate income, so inflation-adjusted yields play a direct role in pricing. When real yields, such as the 10 year TIPS yield rise , holding gold becomes less attractive compared to assets that offer a real return. This can lead to capital rotation away from precious metals.
On February 9, 2026, the 10 year TIPS yield stood around 1.85%, a level that historically aligns with periods of gold weakness.
Historical data shows that rapid increases in real yields often coincide with short-term gold selloffs. Rapid changes in rate expectations tend to amplify this effect because investors quickly adjust portfolios toward assets offering real returns.
However, gold has historically recovered once real yields stabilize or begin to fall again. So, if you focus solely on short-term yield movements, you risk missing the broader context.
RECOMMENDED: Why Central Banks, Falling Dollar & ETF Mania Could Push Gold To $6,000
Short-Term USD Strength
Gold is priced in U.S. dollars, so dollar moves affect demand mechanically. When the dollar strengthens, gold becomes more expensive for buyers using other currencies. This reduces physical buying and ETF inflows outside the U.S. and can trigger selling pressure.
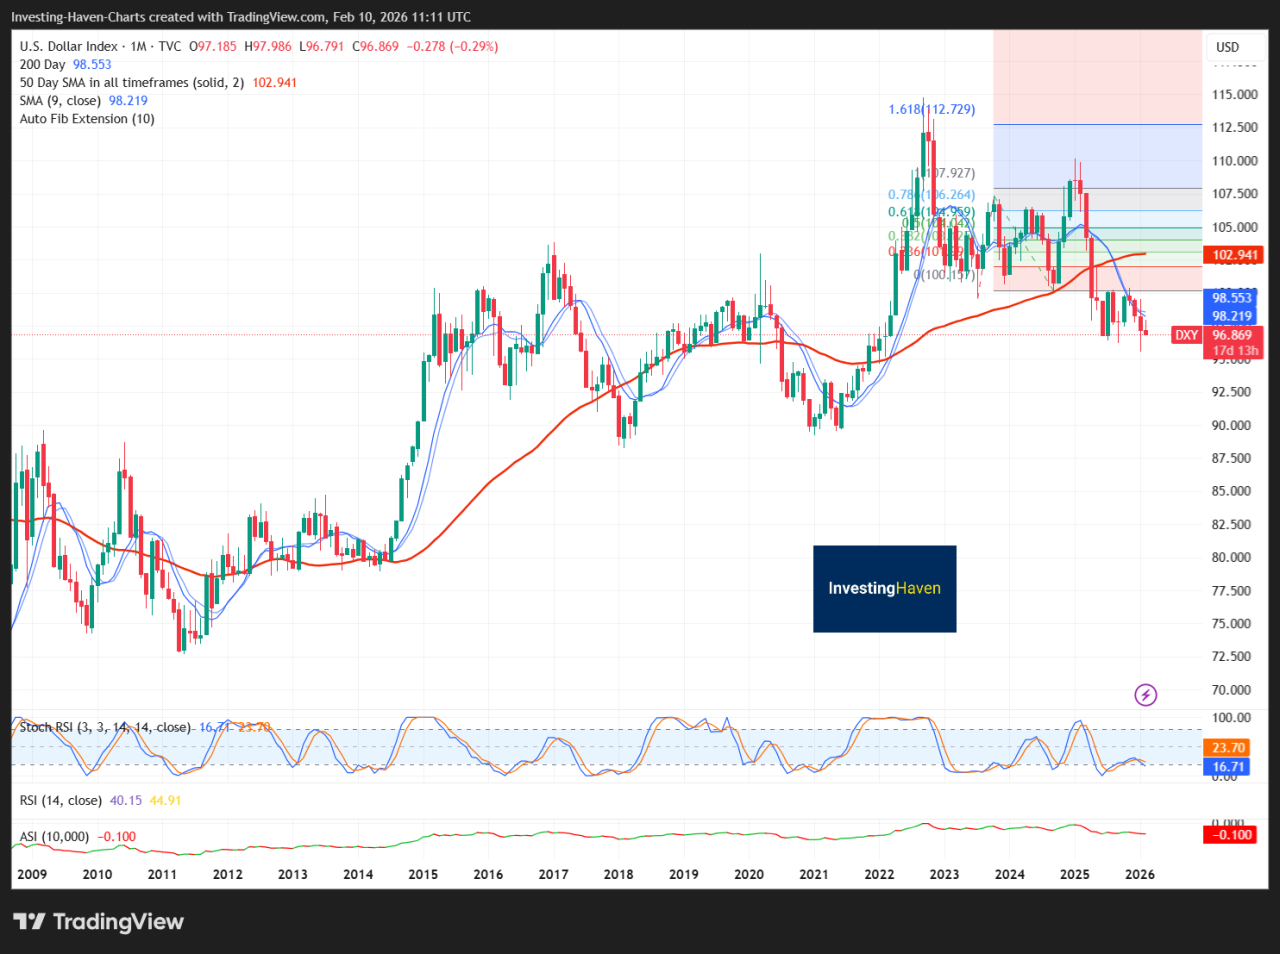
Short-term dollar strength often overlaps with rising real yields, which compounds the effect. When both move higher at the same time, gold usually struggles.
That said, dollar moves alone do not decide the gold trend, but in the short run they play a role in sharp gold pullbacks.
Profit-Taking After Strong Rallies
Strong rallies naturally invite profit-taking. As prices move higher, early investors often lock in gains while leveraged traders reduce risk exposure. This selling can create rapid downward momentum, especially when markets become crowded on the long side.
ETF data shows that large inflows raise the pool of capital that can be trimmed during pullbacks. When professional investors reduce exposure, price moves tend to be fast and emotional.
These declines often look severe on charts, but they usually qualify as a gold correction rather than a breakdown in demand, especially when ETF holdings remain elevated.
RECOMMENDED: JP Morgan Says Gold To Hit $6,300 By Year-End: Is Fiat Finished?
Shifts In Risk Sentiment
Gold acts as a conditional hedge. It performs well when investors worry about inflation, currency stability, or financial stress.
When those fears fade, demand can ease. Short periods of rising equity markets or calmer macro conditions reduce the need for defensive exposure, leading to rotation out of gold.
Gold has fallen 25% to 40% during phases when risk appetite returned, even during longer bull markets. These moves happen often and tend to reverse once pressure eases.
For instance, during the 1970s gold rally, prices suffered multiple pullbacks in the 15% to 30% range while still rising more than 2,000% over the decade.
Market Positioning, Options & Consolidation Phases
Positioning can make gold move faster than fundamentals alone would suggest. When many traders hold large net long positions, prices become fragile. If gold starts to fall, leveraged traders often rush to cut exposure. This adds to selling pressure.
Looking at Weekly CFTC Commitment of Traders data helps show when positioning has become stretched.
Options activity can intensify these moves. Dealers adjust their hedges by buying or selling futures as prices change. When short-dated options dominate trading, these hedging flows can push prices lower or higher very quickly.
This often leads to sharp moves followed by consolidation phases. During consolidation, gold trades sideways as volume and positioning cool off. These pauses usually reset excess speculation without breaking the broader gold trend.
Gold Pullbacks Versus Gold Trend
Distinguishing between a temporary pullback and a genuine trend reversal is one of the most important skills for long-term investors.
A pullback shows itself as a sharp drop after a steep run, followed by a rebound when the pressure that caused the drop eases.
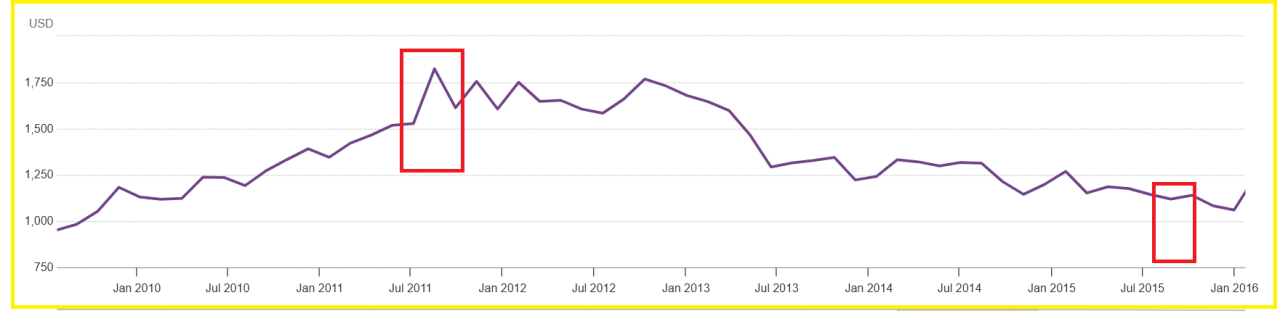
Corrections of 10% to 25% happen often in gold, even during longer rallies. For example, the 2011 peak around $1,999 fell to about $1,049 by December 2015, a decline of roughly 44.6% over that cycle, yet gold later resumed higher levels.
This is unlike in a consolidation where price moves within a range while volume falls and speculative positioning resets.
A trend reversal, on the other hand, needs durable shifts. Sustained rises in real yields, persistent ETF outflows, and weak demand even after the dollar or rates soften usually appear together. Large drops alone do not end a gold trend. Structural shifts do.
ALSO READ: Global Gold Demand Just Hit an All-Time Record
What Investors Should Watch Next
Instead of reacting to headlines or short-term price swings, you can focus on recurring indicators that help explain gold’s behavior over time. These include:
- Real Yields (10 Year TIPS, daily) – Rising real yields increase selling pressure; falling yields support recovery.
- Dollar Strength (DXY, trade-weighted indexes, daily) – Dollar moves combined with real yields provide clearer signals.
- ETF Flows and AUM (monthly) – Large, persistent inflows act as a structural backstop to declines.
- CFTC Commitments Of Traders (weekly) – Rising net long positions indicate vulnerability to rapid corrections.
- Options Gamma and Short-Dated Activity – High short-dated option concentration can amplify moves via dealer hedging.
Conclusion
Drops do not automatically equal a broken gold trend. Gold corrections of 10% to 40% occur inside longer cycles, and history shows deep drawdowns can still end with renewed gains.
The right way to read a fall is to pair macro signals with market structure: real yields, the dollar, ETF flows, CFTC positioning, and options activity.
If most signals tilt against gold for a sustained period, change your gold prediction. If the signals reverse or structural demand remains strong, treat the move as a buying window in a broader gold trend.
Looking for clarity in the gold & silver markets?
Our premium members already have it.
InvestingHaven’s Gold & Silver Premium Alert Service delivers clear, data-driven forecasts built on nearly 20 years of precious metals expertise.
What you get:
Weekly gold & silver trend analysis using leading indicators (CoT, USD, yields, COMEX data).
Turning-point forecasting across multi-timeframe charts.
Actionable insights on GDX, GDXJ, SIL, and SILJ.
Intra-week alerts only when markets move — no noise.
Designed for serious investors who want medium- to long-term guidance, not short-term trading hype.
Join today and get the gold & silver roadmap trusted by disciplined investors worldwide.


