The price of lithium came down in recent months after it reached an ATH back in November. The lithium run occurred right after we wrote Lithium Forecast: Lithium Stocks Will Be Wildly Bullish In 2023. In recent months, however, the lithium space has been consolidating in a wide range. Is there any trend visible or about to start, is the question top of mind of investors.
As a reminder, as said in Lithium: Buy Or Sell, we want to re-iterate that lithium is going through a super cycle. It is not moving in a straight line higher, though, we believe the green battery metals boom will develop in a phased approach as explained in How To Play The Green Battery Super Cycle In 2023:
- The green battery super cycle will move with ups and downs.
- Specific to lithium, we are looking to buy the dip on lithium miners that have great deposits and are near-term producers.
- Whenever the lithium market is going to take off again, momentum will kick in and explorers will outperform.
In our lithium market research, we look at the following criteria to select our favorite lithium miners: Size of the lithium deposit, richness of the lithium deposit, expected year of production, production volume, cost of production, offtake agreements.
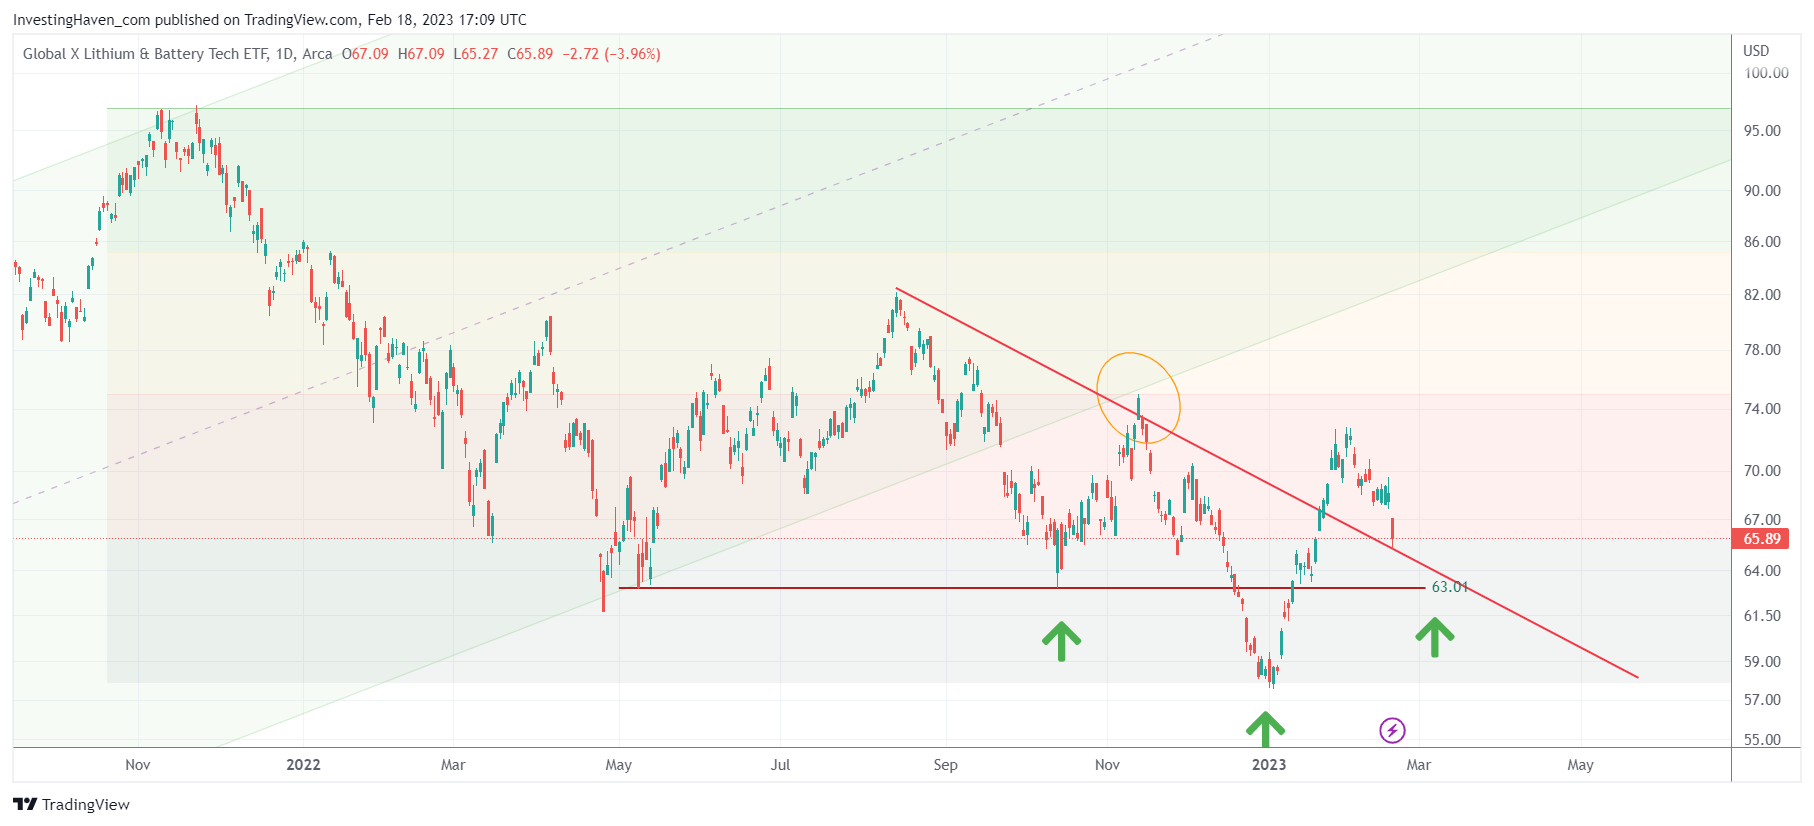
That said, let’s look at the LIT ETF chart, a proxy for the lithium sector (though not one we like but there simply no better alternative). Below is the daily LIT ETF chart.
- The rising channel, green shaded area, broke down in September of 2022.
- Since then, there were 2 dips with a lower low around year-end.
- The latest rally topped the November highs.
Although this looks unstructured, we believe there is lots of structure on this chart. The pattern we start seeing is an inverted head and shoulders which is a bullish pattern. Two of the three parts are complete, the current decline is the last of the three parts.
This implies that LIT ETF should and could drop to 62-63 approximately where it should find support. IF support will hold in the 62-63 area, we believe it will be an exceptional ‘buy the lithium dip’ opportunity!
Note – Investors interested in capitalizing on the long-term uptrend of lithium stocks should consider consulting our top lithium & graphite selection.


