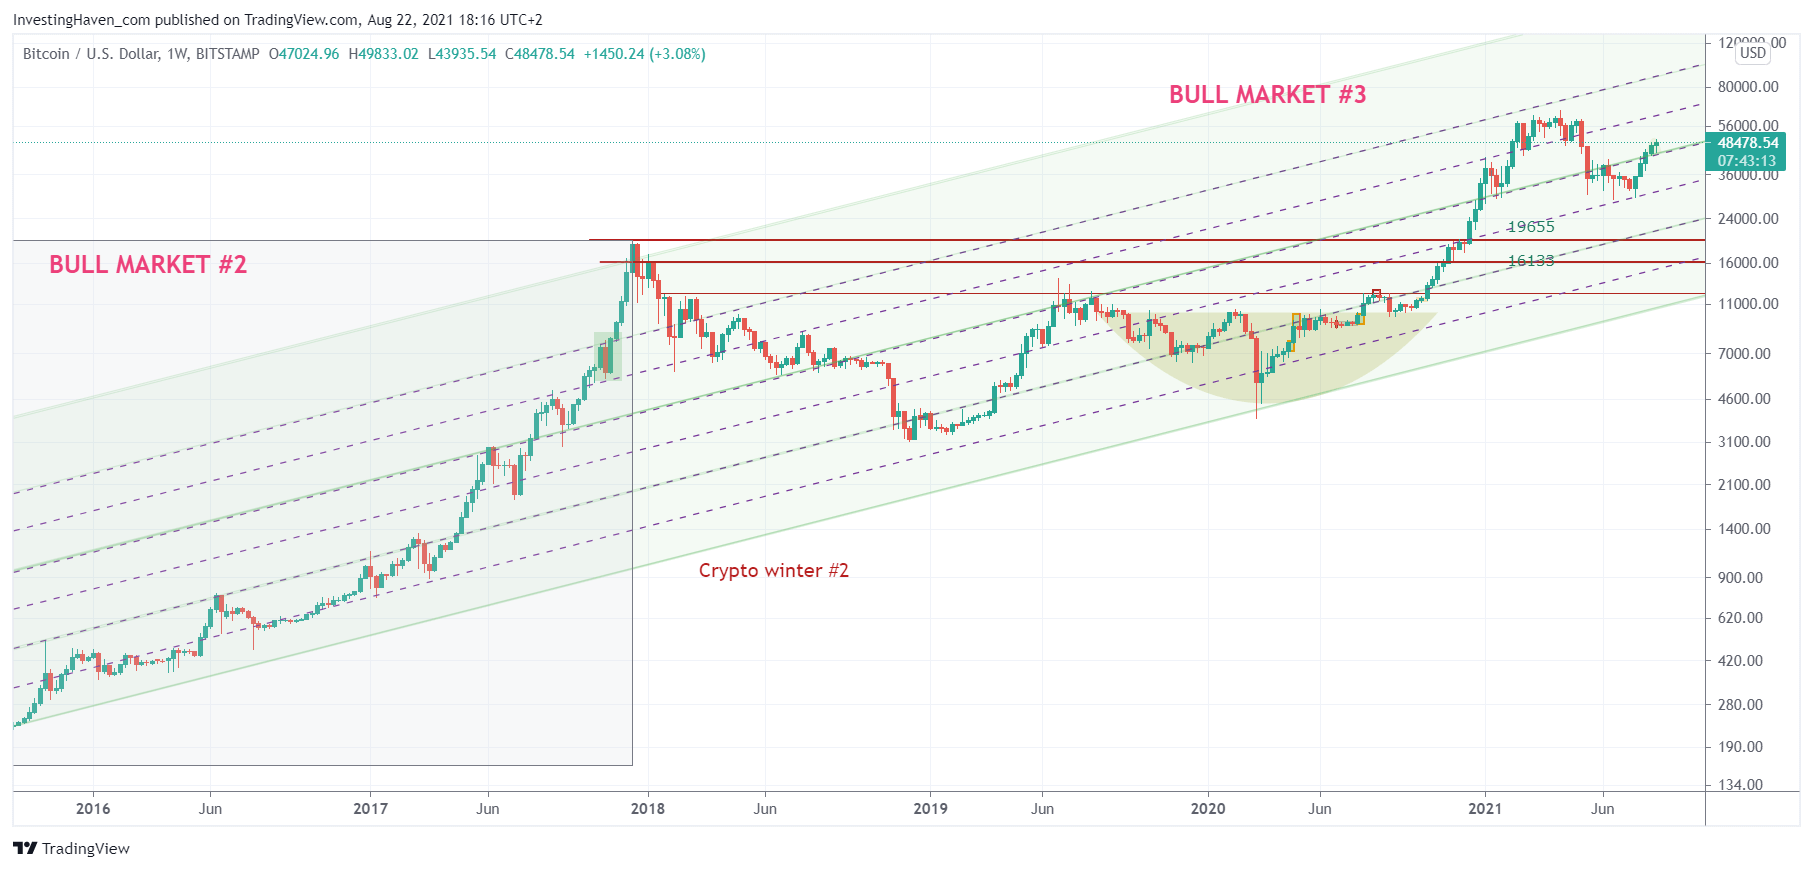
It is very easy to be caught up in short term price changes, especially in hyper volatile markets like crypto. That’s why we always recommend to our members in our investing research services to stay focused on the big picture. It is fine to do short term price analysis, but only in a top down fashion (first the big picture, then the lower timeframes, then relay it back to the big picture). As per our longest term BTC price chart we see an interesting evolution since Thursday: a successful test of the median line on the 10 year trend channel.
It was a pretty important moment last Wednesday/ Thursday when BTC came back down to 44k where it not only found support but also bounced back up pretty strongly.
Why is 44k such an important level?
We have to zoom out on the longest term chart to see the answer to this question. Below is the long term chart with the 10 year rising trend channel.
It might not be very clear from this chart but there is this median line (4th dotted line when counting from the bottom of the channel to the upside).
If you look carefully you’ll notice that BTC went higher last week after touching this median line.
What does this implies is very simple:
- As long as 44k is respected, on a 3 to 5 day closing basis, it implies that BTC wants to move higher.
- BTC will hit resistance now, as it moves above 50k (that’s an IF statement).
- Depending strength above 50k, and strength above 40k, we will start seeing whether BTC is able and willing to move to all time highs OR whether it did run its course.
In sum, the big picture story of BTC is really centered around this key level: 44k (for some exchanges it might be slightly lower, say 43.5k, and it is a dynamic price point which means it rises 2% per month).
It will be a few very interesting weeks in crypto markets, and we stay focused on the 44k level in BTC, as per our research and writings in our crypto investing research service.


