As per our China Stock Market Forecast For 2019 we said our expectation was China’s long term uptrend to hold. So far so good, and it is imperative that long term oriented China stock market investors focus on the monthly closes. The monthly close of September 2018 looks positive.
This short and chart focused article is meant to focus on the long term pattern.
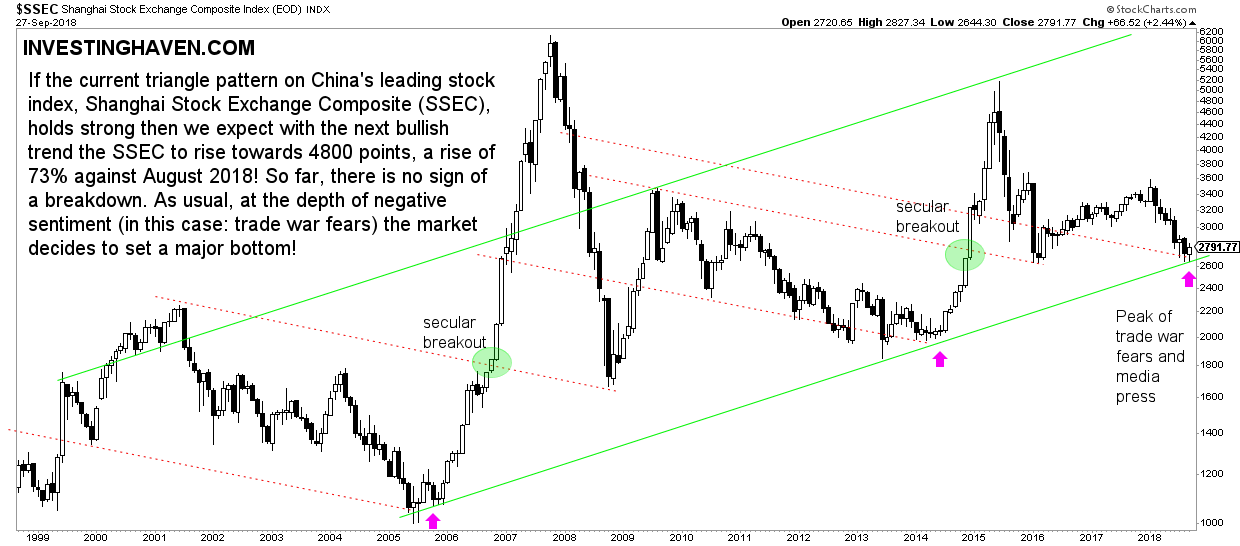
The monthly chart of China’s leading stock market indicator, the SSEC embedded below, carries important information at the end of each month. In particular, the candlestick at the end of each month shows the lowest and highest point of that month, along with the closing price.
As seen on below chart, one day before the end of this month (the final monthly closing price, a couple of hours ago, is 2821 points, slightly above the price marked on the chart), the Shanghai Composite SSEC index (SSEC) closed way above its lowest point, not very far from its highest point. Moreover, the lowest point in September 2018 was right on the secular trend line, around 2640 points, certainly not lower.
This is extremely important information because China stock market bulls do not want to see any monthly close below 2640 points + ideally not any daily dip below 2640 points.
As said in our forecast:
Similar to the 2 other instances in which it dipped to its rising long term trendline we believe it may stay there for 2 more months before it starts a monster rally. In both previous instances it consolidated for around 6 months before it rose very strongly. Once it went up more than 6-fold while in 2015 it went up almost 3-fold.
September 2018 is the 4th month in a row in which the SSEC was trading very close to its long term uptrend (bottom area of its secular rising channel). In previous similar instances the SSEC started rising strongly around the 7th month. If history is any guide we expect a strong rally to start in November or December of this year.
The flipside: a bearish case will play out once 2600 is broken to the downside on any of the next monthly closes.


