Policy makers around the world are stimulating economies based on monetary and fiscal stimulus. Like crazy. This is inflationary, and our inflation expectations indicator is (strongly) bullish. This is good for commodities as well as crypto markets, is our investing thesis. Can we find any signal on the commodities chart to back up our thesis? Yes, we can!
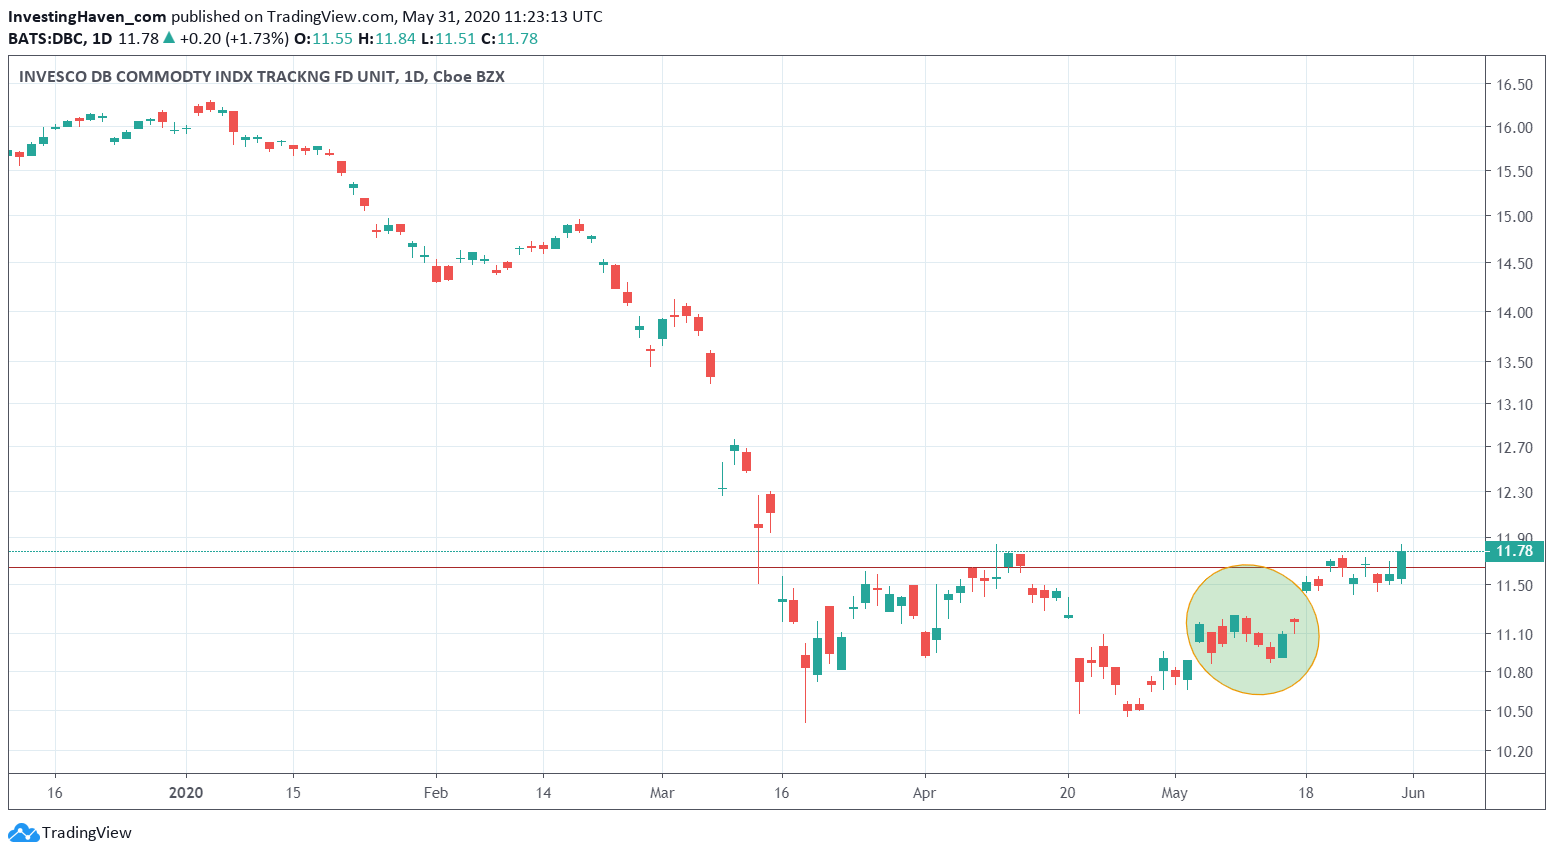
Below is the DBC index, a representation of the commodities complex.
Guess what, this shows a strongly bullish move is underway.
Wait a second, we hear you thinking, this index has crashed to multi year lows. It is struggling on its chart, visibly. It even cannot break above a certain level. How can this be bullish?
Let’s make one thing very, very clear. This chart setup has all the characteristics of a greatly bullish outcome.
Charts have a lot of information, but not always in a way you would expect it. The below chart has a clear bullish reversal setup, and more importantly it has exactly all the characteristics of a confirmation of this bullish outcome right at the ‘sweet spot’ of its reversal.
The devil is in the details, and very experienced chartists will see immediately what we mean.
Regardless, we are on record saying that commodities will do very well. No surprise, gold and silver did introduce this with strongly bullish setups in recent weeks and days.


