What’s the trend in emerging markets? What’s our forecast in emerging markets? It’s the type of question we recently received from different members of our premium service which is about short term trade signals in the S&P 500, emerging markets, and precious metals. Interestingly, we have an outspoken answer to this question, but at the same time it’s not a direct answer, at all in fact. And the answer is that the future of emerging markets will depend on what is going to ‘happen’ at current levels just because emerging markets arrived at a pivot point that goes back 10 years in time.
We look at EEM ETF as a proxy for emerging markets, in order to identify an ongoing trend or forecast a future trend.
After reviewing multiple chart versions at multiple timeframes we concluded that the very long term chart has the clue. And the clue is that there is no answer, as of yet, but an answer will become clear sooner rather than later.
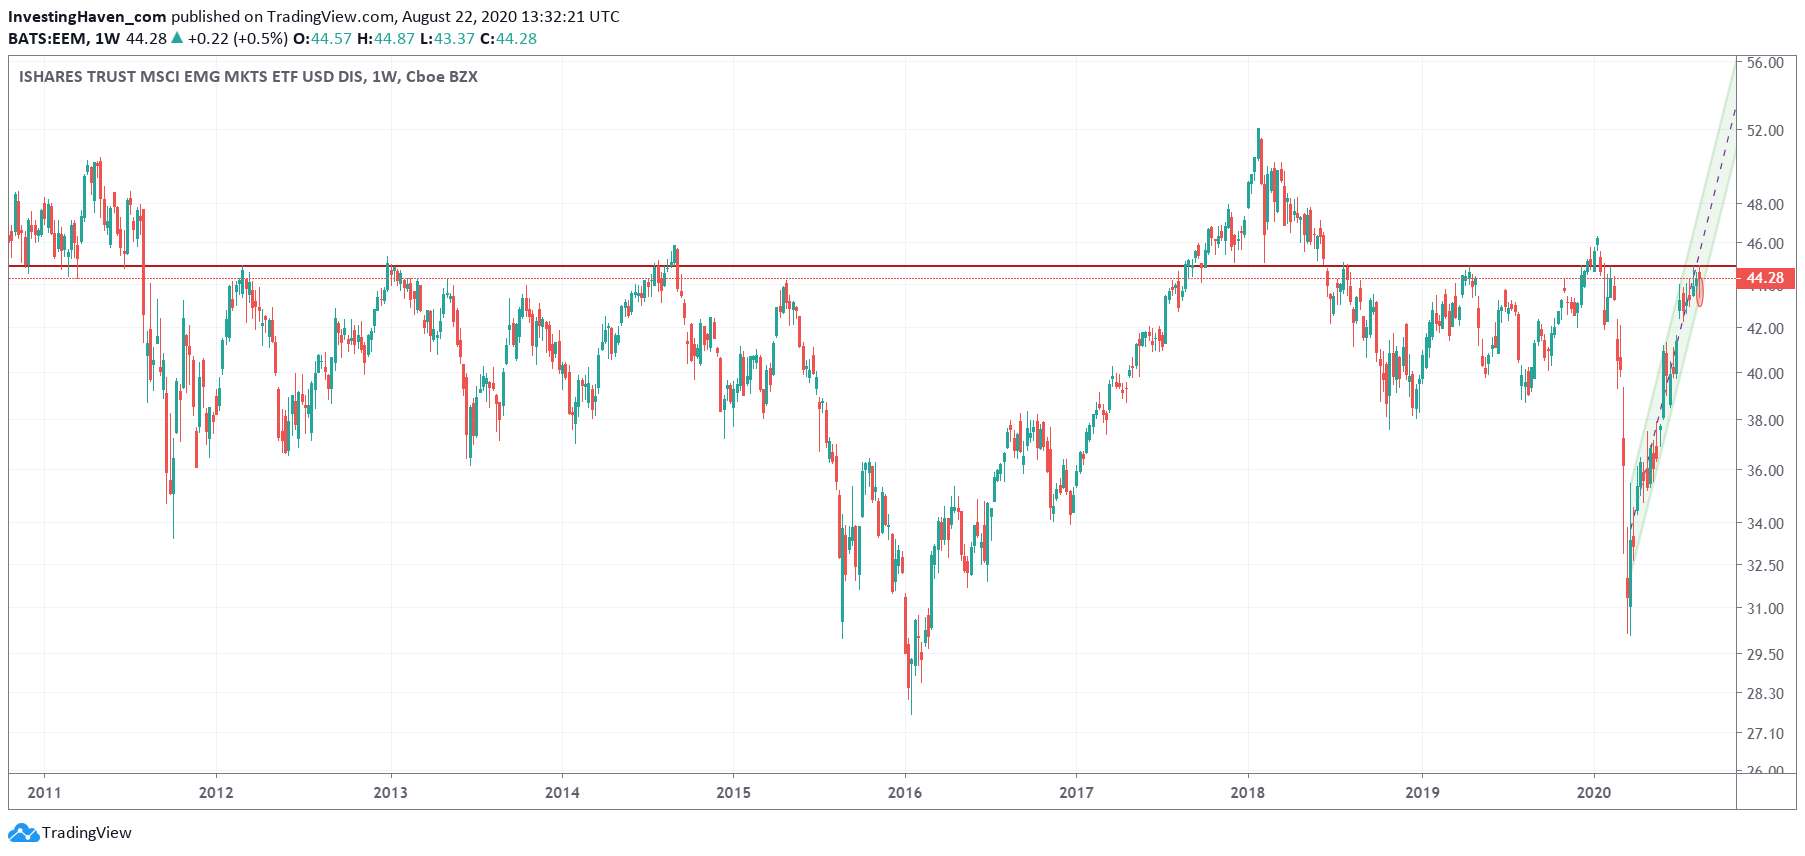
Interestingly, the long term EEM chart shows that the current level (approx. 45 points) has been resistance in 7 different instances in the last 10 years. Similarly, those few months in which EEM was trading above 45 points it had been acting as strong support.
The thick red line on below chart visualizes our point.
Stated differently, it is hardly possible to forecast what is going to happen from here. Yes, there is an uptrend post-Corona crash, as shown with the green rising channel on below chart. However, 45 points will act as a key pivot point, for sure.
Much of what will happen from here will depend on what the Euro and the U.S. Dollar will do, is our point of view. The Euro is looking pretty bullish, and our point of view is that as long as the Euro does not dip for more than 3 consecutive days in a row below 1.17 it will continue to support a bullish trend in emerging markets.

![[:en]emerging stock markets[:nl]groeimarkten[:]](https://investinghaven.com/wp-content/uploads/2017/05/emerging_stock_markets-1024x682.jpg)


