Global stock markets recovered strongly in January. In revising monthly charts of global stock markets one conclusion stood out. Emerging markets (EEM) have a great setup. They may have recovered in a similar fashion and with a similar magnitude as other stock markets elsewhere globally, but the pattern that becomes visible is what smart investors are focused on. We may be close to a confirmation of our emerging markets outlook 2019 and forecast of top emerging markets.
The chart pattern is what it’s all about. The chart pattern is according to our method the first and foremost thing to watch. One of our 100 investing tips says “start with the chart”, and this is what it means:
The chart is crucial, and it is the most factual and data driven way to look at any market. That’s why we apply the ‘start with the chart’ principle. It means we first identify trends and opportunities in assets or markets based on chart patterns, only to consider this as green light to look into fundamentals and, when relevant, financials. So first the chart, then fundamentals.
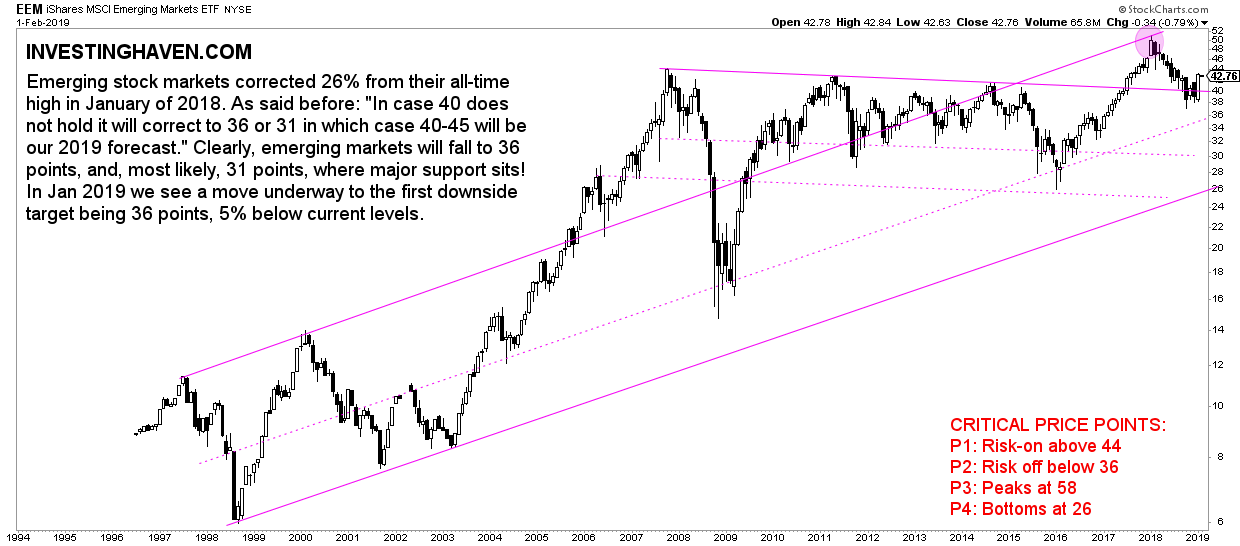
The emerging markets chart is morphing into a great pattern.
Emerging markets stocks stopped falling near their breakout level! They are forming a base which might be very bullish for 2019. The 36 to 40 area in EEM ETF held strong.
More importantly, it helps us put the 2018 decline into perspective. What stands out is ttis might be the end of the bearish trend of 2018. If so (that’s a big IF though) 2018 would qualify as a tactical bear market. In that scenario it would have be retest of the giant breakout of 2017, from a chart perspective. This would be amazingly bullish for the next few years.
Some more data is required to get this confirmation, so we need to stay focused on the monthly closing prices. In terms of EEM ETF we want to see monthly closings above 40 points.
Note that even the Shanghai stock exchange (SSEC) is close to becoming bullish. However, more work is required, and it absolutely needs to rise above 2750 points in February in order to be part of the bullish emerging markets group.
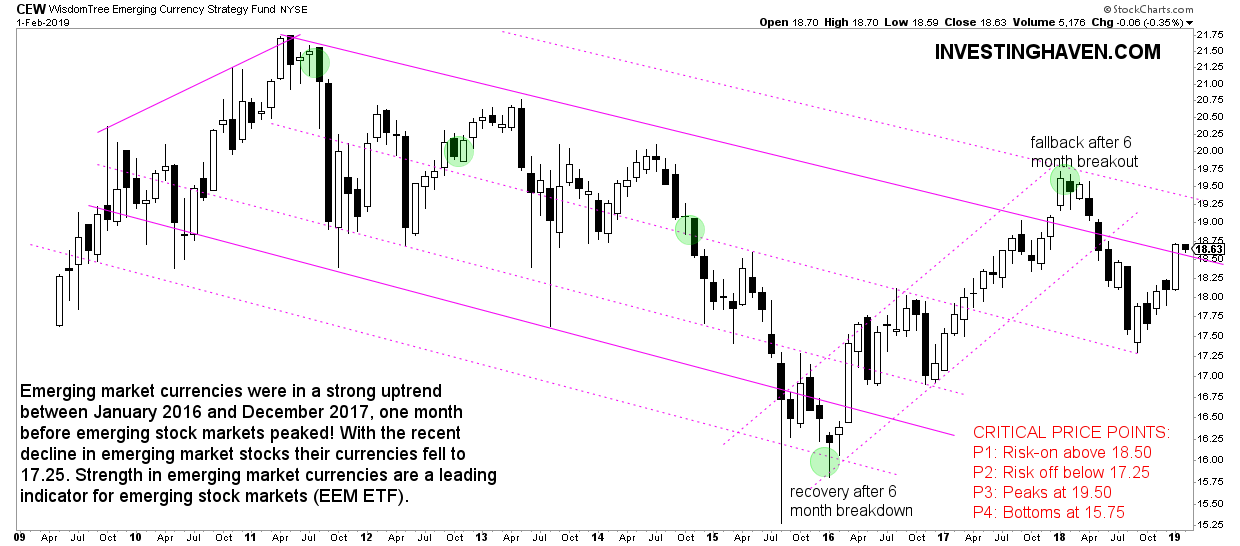
We consider emerging markets currencies the leading indicator for emerging market stocks.
As seen on below chart emerging markets currencies are bullish above 18.50. For now they confirm our bullish stance of emerging market stocks.


