There we go again. Fear in financial markets is on the rise. Our risk indicator suggests the new cycle which is about to start tomorrow might be characterized by ‘risk off’ as opposed to the ‘risk on’ cycle we saw in April and May of 2020. What’s the concern, what’s the impact?
Let’s review our risk indicator which is TLT ETF.
The short to medium term chart has a great setup, which in ‘risk indicator’ terms is not so great for risk assets like stocks or commodities.
The chart without annotations shows this massive spike in March, followed by a gradual decline in April / May (falling risk indicator means increasing risk appetite among investors).
However, in recent weeks there is a reversal visible on this chart. This suggests risk appetite is fading, not good for stocks, crypto, etc.
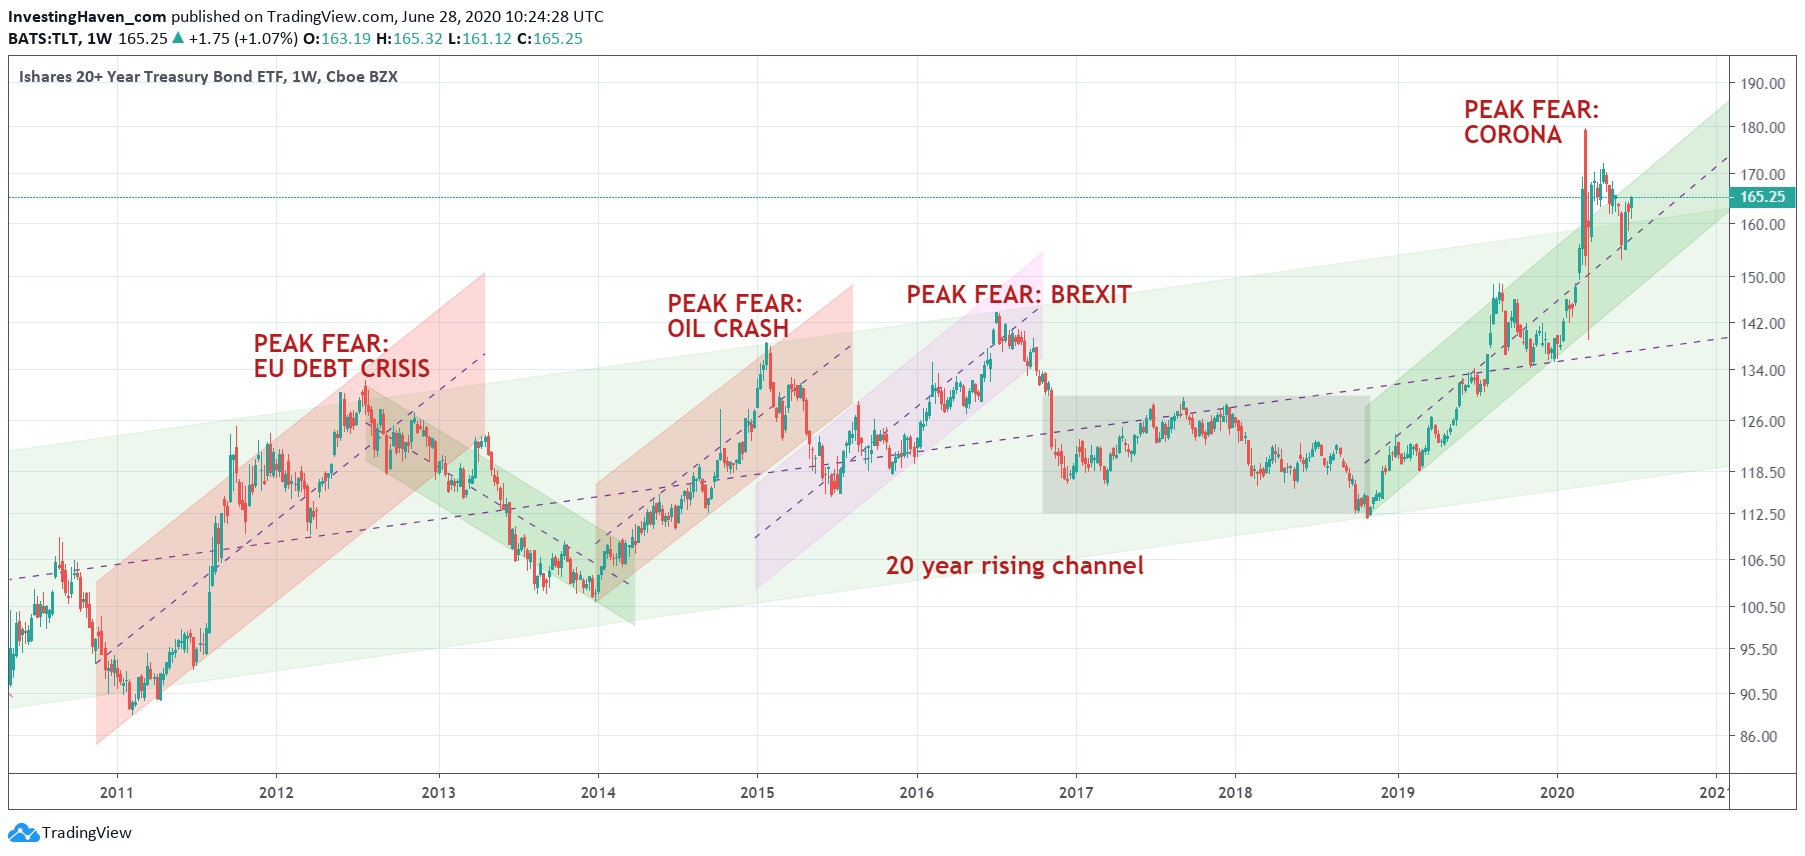
The very long term chart is really breath taking as a chart, but that does not necessarily reflect how investors think of it / experience it.
The key take away from this chart is the once-in-a-generation type of sell off (corona crash) that created a spike never seen before (even not in 2009, not visible on this chart). The Corona ‘peak fear’ formation went way above the 20 year rising trend. Not only this, but it’s also on the rise now, again above that same 20 year trend (after falling back into it in April/May).
The fact that this risk indicator is moving (again) above its 20 year trend pattern is reason for concern. It’s a red flag, for sure, and it requires a lot of our attention to understand how this will resolve.
If anything, at InvestingHaven, we deal wit any circumstance and any challenge. All our risk indicators are part of our daily crash analysis.


