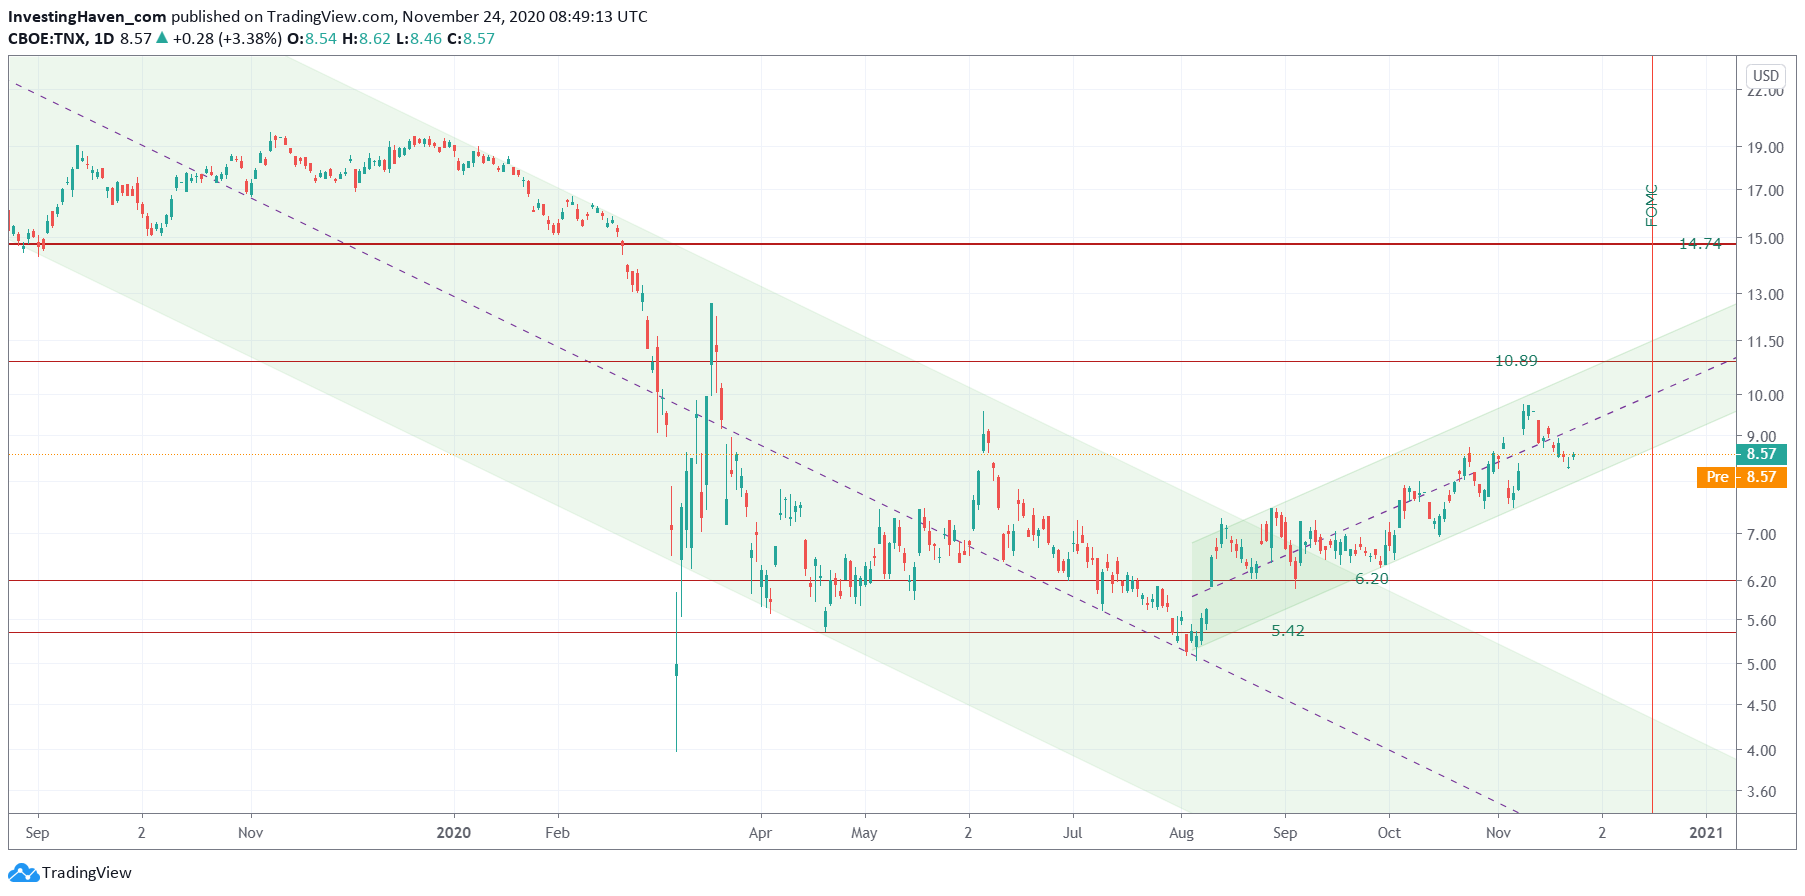
We made the case for financial stocks several months ago, and forecasted they would rise strongly. The writing was on the wall, and it was visible on the TNX chart. The result? Financial stocks were, once again yesterday, among the top performing sectors. This will continue at least in the foreseeable future, going into 2021. Members of our Momentum Investing portfolio hold 2 financial stocks which are up more than 20% approx. one month. That’s how solid the Momentum Investing returns are!
The TNX chart embedded in this article has 4 distinct phases in the last year:
- A consolidation in 2019, sort of.
- A crash starting early 2020, which resulted in the ‘Corona crash’.
- A long and strong consolidation mid-2020.
- The new uptrend.
TNX is the yield on 10 year Treasuries. We call it ‘interest rates’, but technically it is bond yields.
Why is this a driver for financial stocks.
Because its the leading indicator. As per our 100 Investing Tips For Success investors better work with a leading indicator for their investments. Without a leading indicator we wish you all the best of the luck getting your investment right, timing right, exit right.
The TNX chart says that we will see strong performance in financial stocks in the weeks heading into 2021.
Want to join our Momentum Investing service? Our performance exceeds +100% in profits for trades taken in 2020, we are about to end the year at 125% according to our calculations. As of Jan 1st, 2021, rates will go up, because of the exceptional performance of our portfolio and unique market readings (yes, based on leading indicators).


