‘The art of the chart’ is how we tend to describe chart analysis. It is the basis for all our forecasts. As per our 100 investing tips the real secret behind all this is that every forecast requires a different chart analysis angle. That’s why it’s not easy to consistently forecast accurately. As per requests of many followers we reveal one secret of how we forecast stock market turning points. This is also the forecasting method underlying our 15 Leading Indicators For The Dominant Market Trend as well as the method we apply to determine the timing of our TOP 3 Investing Opportunities Of 2019.
The reason why this topic is so important has to do with the dangers of investing. As explained in great detail in 10 Tips To Master Investing Without Emotions it is emotions that will play against you. Yes, this applies to each and every investor on this planet. The only way to overcome this risk related to emotions is by neutralizing it by using (advanced) chart analysis.
It is in the context of chart analysis that a set of leading indicators can be identified.
One small secret which we will reveal today is about the leading indicators we use for forecasting stock market trends, especially in the U.S.
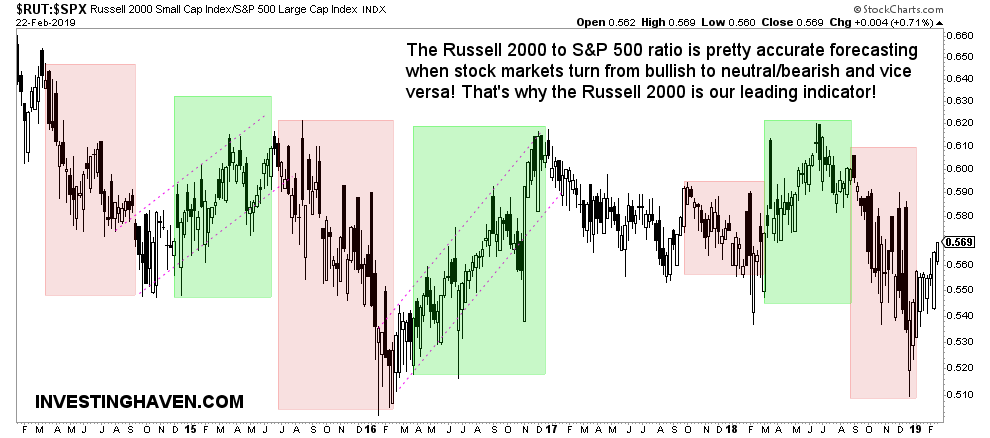
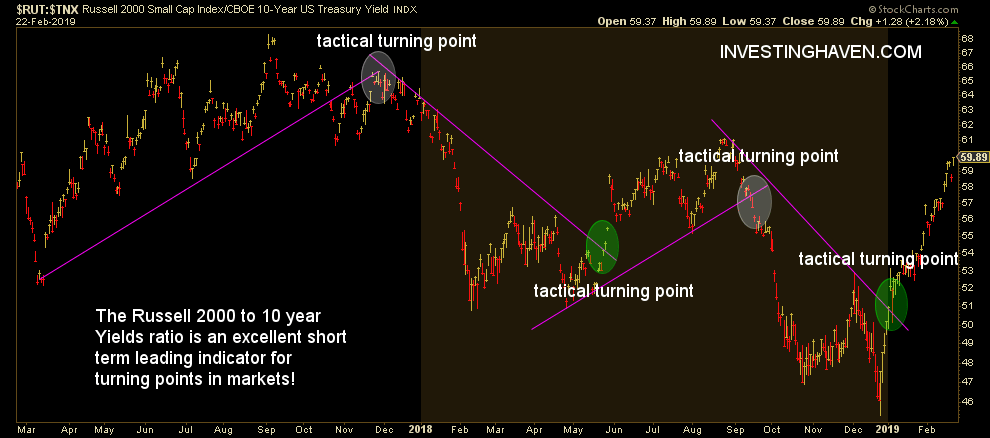
The secret about forecasting U.S. stock markets and turning points is to properly use 3 charts and leading indicators. First, on the highest level and longest timeframe, the 10 year Yields determine the multi-quarter risk on / risk off direction of stock markets as they move from top to bottom in rising or falling channels. Second, on a multi-year timeframe, the Russell 2000 to S&P 500 ratio determines the turning points based on breakout and breakdown patterns. Third, on an intra-year basis, the Russell 2000 to 10 year Yields ratio determines the turning points based on breakout and breakdown patterns.
Note that we will only reveal a secret like this one once in the public domain!
As seen in above quote it is a combination of things that is required to forecast trends in U.S. stock markets:
- Identifying the relevant leading indicators (the ones that deliver accurate results consistently).
- Extending the leading indicators for different timeframes.
- Identifying which chart analysis pattern and method applies for each leading indicator.
To illustrate this we include two examples.
First, the Russell 2000 to S&P 500 ratio determines the turning points based on breakout and breakdown patterns.
As seen, we use the weekly chart. The visible patterns of higher lows and lower highs is the pattern that is relevant for this leading indicator!

Second, the Russell 2000 to S&P 500 ratio determines the turning points based on breakout and breakdown patterns. Third, on an intra-year basis, the Russell 2000 to 10 year Yields ratio determines the turning points based on breakout and breakdown patterns.
As seen, we use the daily chart. The pattern of breakouts and breakdowns are the ones that are relevant in this context!

The problem with investing tips is that most people start with sites that also have a commercial purpose. Investopedia, although a respected and giant site, is known to have so many links to brokers and other commercial affiliated services that it becomes tricky to differentiate the real content from commercial content. This Investing 101 tutorial makes the point.
This tutorial does even not talk about charts and chart analysis whatsoever. How on earth are you able to spot TOP investing opportunities without charts?
Note that we are so convinced about our work and the outcome of applying these 100 investing tips that we believe we deserve a spot in this blog post about top investing blogs with top tips in all humbleness.
Ed. note: Want to stay on par with the rhythm of markets? Subscribe to our weekly forecasting newsletter to receive all our updates for free!


