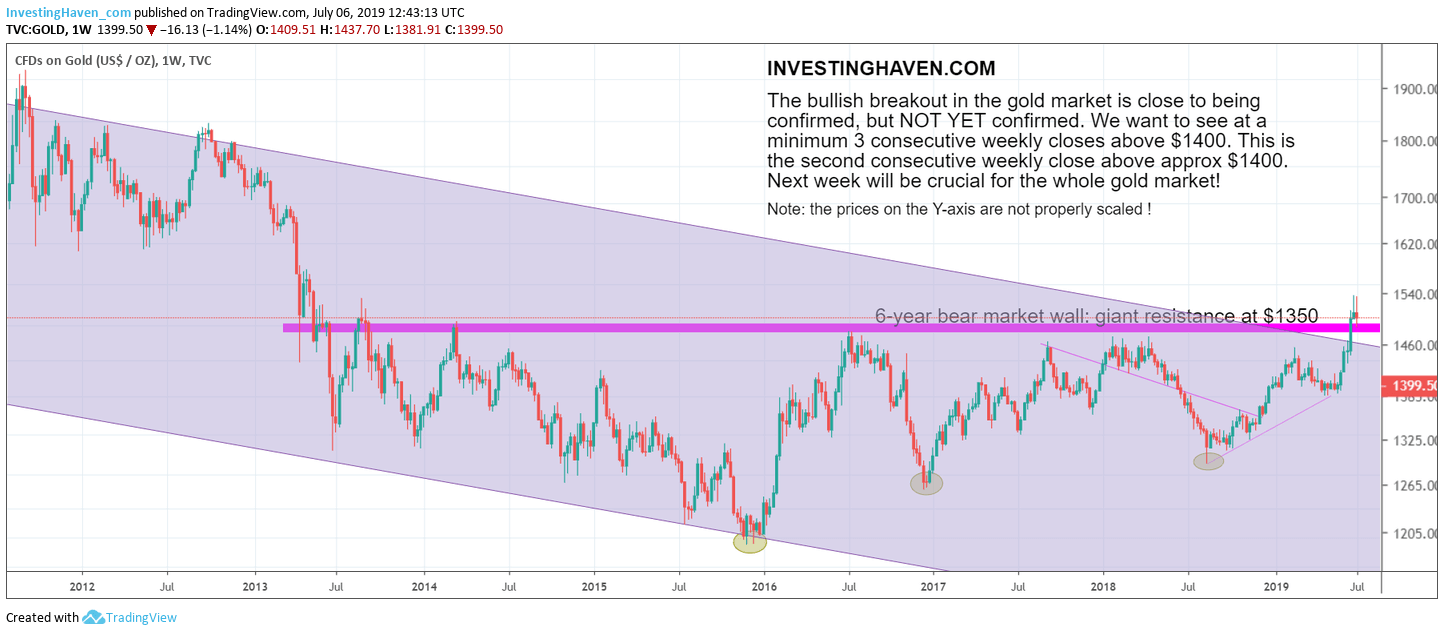
Is the gold market still bullish? Almost, is the right answer. There are many indicators and ratios to track the gold market, but there is one (and only one) right leading indicator for the gold market. That’s the gold price, and its dominant chart pattern. This is the 2nd consecutive weekly close 1375 USD, even 1400 USD. And all that we want to see is 3 consecutive weekly closes above, ideally, 1400 USD. It would be as close as a confirmation can get of a bullish breakout for the gold market. If this happens our bullish gold prediction for 2019 will get hit as well as our silver prediction for 2019. Moreover, our top gold stocks will outperform and our First Majestic Silver stock forecast will be THE precious metals investment of 2019 and 2020, making it one of the top investing opportunities of 2019!
Early June we signaled a potentially very bullish move in gold when we wrote What Happens If Gold’s Price Rises 2 Pct And Breaks Out. Gold was coming close to its 6 year bear market wall at $1350.
Just 2 weeks later, mid-June, we saw the first rise above $1350 since 2013. This is when we wrote Gold Enters New Bull Market Right Before Its 8th Bear Market Anniversary.
We want to warn our followers to give the market the time it needs to confirm a new trend. Remember a trend change is a one-off event, it requires time and effort to turn a bear trend into a bull trend.
On the other hand bear markets do not go on endlessly. As per our 100 investing tips:
‘Bear markets beget bull markets‘. It is at the depth of a bear market that all sellers leave, which makes place for a market to consolidate and set the basis to turn into a future bull market.
Patience is a virtue for investors. Timing as well. Both combined are the recipe for success.
So all that said, we look at the gold market now and observe one crucial thing: gold is close to confirm its bullish breakout, but needs at a minimum one more week to close above 1375 USD, ideally above 1400 USD.
Do not get trapped into the bullish gold news trap. The bullish bias of news is NOT a leading indicator.
As seen on the weekly gold price chart below we now have 2 consecutive weekly closes in place above (or at) 1400 USD.
Again, all that counts is gold’s pattern. Only if and when gold confirms its bullish breakout will we have green light for any related precious metals investing opportunity!


