Investing Haven
No Result
View All Result
Gold Silver Investing >>
CRYPTO INVESTING >>
  • 2026 Forecasts
    • 10 market predictions
    • Dow Jones forecast
    • S&P 500 forecast 2026
    • Nasdaq prediction 2026
    • Best altcoins to buy in 2026
    • Best crypto to buy now
    • Which crypto will explode
    • 15 crypto forecasts 2026
    • Which precious metal to buy
  • Silver
    • Silver prediction 2026 – 2031
    • Can silver hit $100?
    • Silver shortage
    • 50-year silver chart
    • Silver bullish reversal
    • Silver seasonality charts
    • How to invest in silver
  • Gold
    • Gold prediction 2026 – 2031
    • Will gold set new ATH?
    • Can gold hit $10,000?
    • Gold chart 10 years
    • Gold chart 50 years
    • Gold chart 100 years
    • Gold silver ratio
    • Gold seasonality charts
  • Commodities
    • Coffee forecasts
    • Sugar forecasts
    • Nickel forecasts
    • Lithium investing
  • Crypto forecasts
    • BTC prediction 2026 – 2031
    • ETH prediction 2026 – 2031
    • SOL prediction 2026 – 2031
    • XRP prediction 2026 – 2031
    • XLM prediction 2026 – 2031
    • BNB prediction 2026 – 2031
    • ADA prediction 2026 – 2031
    • AVAX prediction 2026 – 2031
    • KAS prediction 2026 – 2031
    • NEAR prediction 2026 – 2031
    • BCH prediction 2026 – 2031
    • LINK prediction 2026 – 2031
    • DOT prediction 2026 – 2031
    • SUI prediction 2026 – 2031
    • ICP prediction 2026 – 2031
    • LTC prediction 2026 – 2031
    • STX prediction 2026 – 2031
    • DOGE prediction 2026 – 2031
    • SHIB prediction 2026 – 2031
    • PEPE prediction 2026 – 2031
    • FLOKI prediction 2026 – 2031
    • WIF prediction 2026 – 2031
    • ONDO prediction 2026 – 2031
  • News
    • Crypto news
      • Bitcoin
      • Ethereum
      • XRP
      • Solana
      • Dogecoin
      • Cardano
      • Litecoin
    • Commodities
      • Gold
      • Silver
    • Markets & Stocks
    • Press Releases
  • Reviews
  • Login
Investing Haven
No Result
View All Result

Home » Markets & Stocks » India Stock Market At Major Decision Point As 2019 Kicks Off

India Stock Market At Major Decision Point As 2019 Kicks Off

Taki T. by Taki T.
February 2, 2019
in Markets & Stocks
india stock market
Share on FacebookShare on Twitter

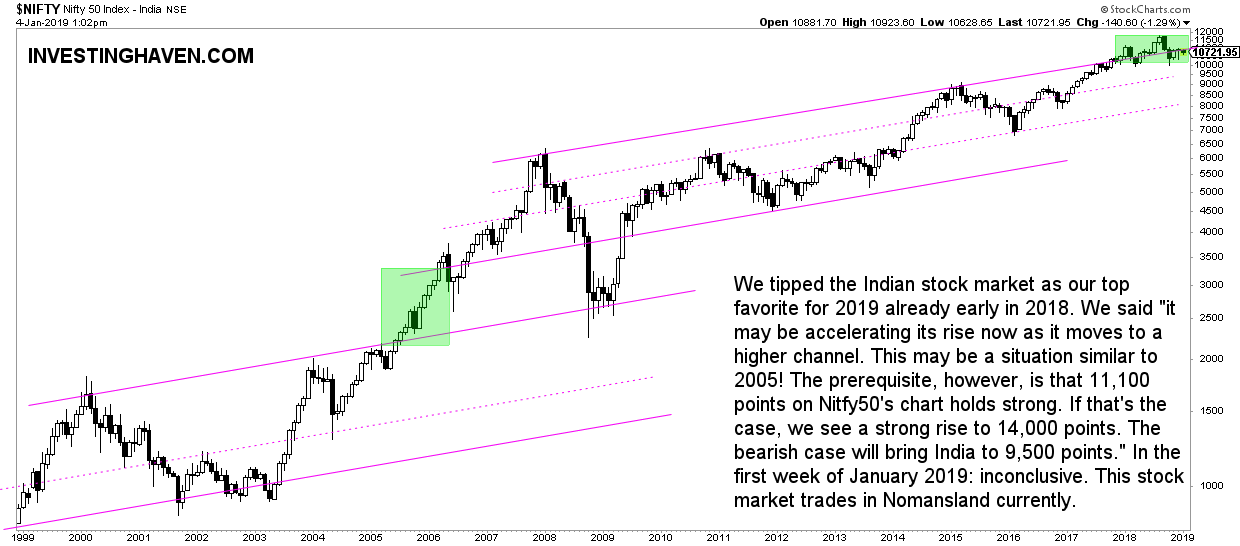
As per our India stock market forecast 2019 we tipped the Indian stock market as our top favorite for 2019. We did so more than 3 months ago. We identified 10,800 points in the Nifty 50 Index (NIFTY) as the line in the sand. Today, this index trades at the same level. In other words, the Indian stock market continues to be at a major make-or-break level, though we see an even more challenging picture in the Bombay top 30 index. The findings in this article are in line with the ones from our 15 leading indicators and dominant market trends.

India Stock Market At Major Decision Point Early 2019

We explained in our 2019 forecast on the Indian stock market that both economic fundamental data points and leading indicators suggested a major decision point. We also showed this on the chart of Indian stocks chart specifically the Nifty 50.

As said in our 4 Top Emerging Markets in 2019 (EEM) the long term chart of India tries to move from the current rising channel to a higher one (not created yet on the chart). That’s the key in forecasting: try to identify a point where a market is heading towards.

We strongly sense that India will accelerate its rise. If that’s what is happening right now we will see a similar move as the one in 2005 where India moved to a higher level channel.

So, in sum, if economic data and leading indicators continue to favor India’s stock market, and Nifty 50 continues to trade above 10,800 points, it will likely accelerate its rise. In this case we will see 15,000 points in India’s stock market in 2019.

The first chart which represents the Nifty 50, top 50 companies in India, helps understand the points made above.

indian stocks decision point 2019

All conclusion made before are still relevant:

  • It is an absolute must that 10,800 points should hold.
  • If not the subsequent decline would bring this index to 8,500 à 9,500 points.
  • However, if support holds we see a rise back to 11,000 points.

The key finding about Indian stocks is that if and once it starts rallying it would rise to a higher channel. “This may be a situation similar to 2005! The prerequisite, however, is that 11,100 points on Nitfy50’s chart holds strong. If that’s the case, we see a strong rise to 14,000 points.”

India Stock Market: More Evidence of Decision Point in 2019

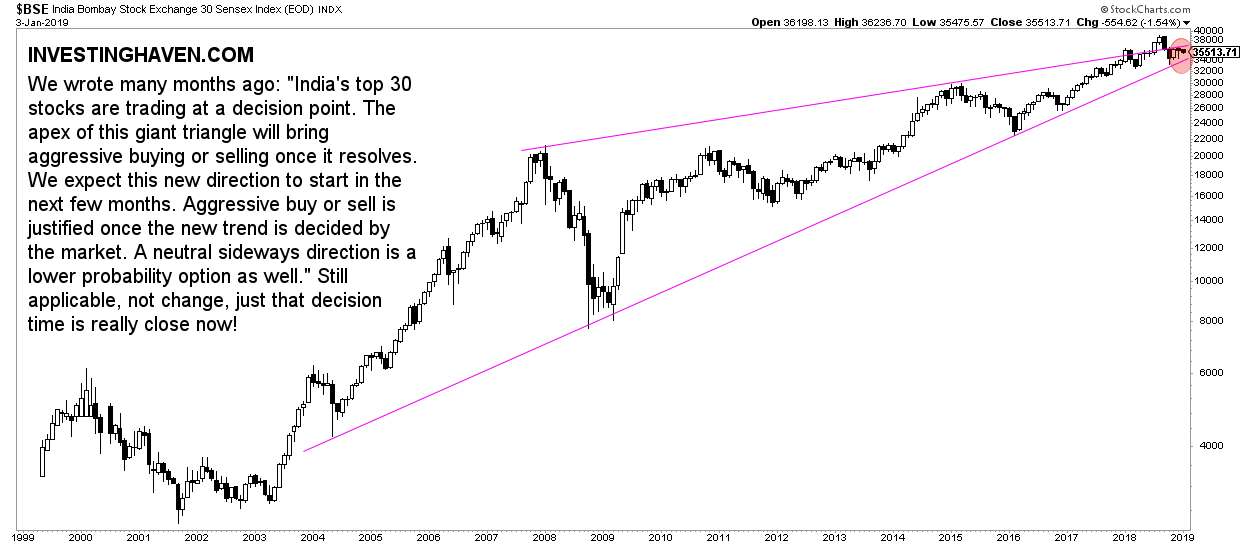
There is this other key index for the Indian stock market: the Bombay 30 index.

We wrote many months ago: “India’s top 30 stocks are trading at a decision point. The apex of this giant triangle will bring aggressive buying or selling once it resolves. We expect this new direction to start in the next few months. Aggressive buy or sell is justified once the new trend is decided by the market. A neutral sideways direction is a lower probability option as well.”

Below is the chart of the Bombay 30 index. It makes our point. The conclusions from back then are still applicable other than decision time is really close now!

What this second chart adds in terms of value is that it shows even more how important this make-or-break level is. The giant triangle in this specific form will have major implications once it breaks out or break down.

Stay tuned, in a couple of weeks, ultimately a couple of months, we will have an answer on the new trend in 2019 when it comes to Indian stocks.

indian stocks decision point 2019 bse30

10-YEAR ANNIVERSARY OFFER: InvestingHaven.com celebrates 10 years. Temporarily, you can enjoy a discount on our premium gold/silver and crypto reports. Or you can become a VIP member. Go to our anniversary deals >>
Receive our weekly newsletter.

premium service SP-500 premium service trade alerts premium service crypto teaser 

No related posts.

Tags: NIFTY50
Taki T.

Taki T.

Taki is a chart analyst who is passionate about unlocking unique insights out the chart. While the vast majority of analysts remain focused on price analysis, Taki starts with timeline analysis and adds price analysis to this. In doing so, he developed a unique methodology to find opportunities in financial markets, across assets and markets.

Connect with InvestingHaven

Receive top notch forecasts for free.

*We hate spam as you do.

Site Navigation

  • RSS Feed
  • Advertising
    • Sponsored Content Policy
  • Advertising Disclosure
  • Risk Disclosure
  • Privacy Policy
  • Terms of Service
  • Sitemap
  • About us
  • Contact Us
investing haven logo

Precious metals market analysis including gold and silver price predictions. Crypto market analysis including highly accurate BTC ETH SOL XRP forecasts.

Copyright © 2025 InvestingHaven

Login to your account below

Forgotten Password?

Fill the forms bellow to register

All fields are required. Log In

Retrieve your password

Please enter your username or email address to reset your password.

Log In

Receive top notch forecasts for free.

*We hate spam as you do.

The views and opinions expressed in this article are solely those of the author and do not necessarily represent the official position, policies, or views of InvestingHaven or its affiliates. This content is provided for informational purposes only and does not constitute financial, investment, legal, or other professional advice. Readers are advised to conduct their own research and consult with a qualified financial advisor before making any investment decisions.

No Result
View All Result
  • 2026 Forecasts
    • 10 market predictions
    • Dow Jones forecast 2026
    • S&P 500 forecast 2026
    • Nasdaq prediction 2026
    • Best crypto to buy now
    • Which crypto will explode
    • Best altcoins to buy
    • 15 crypto forecasts 2026
    • Which precious metal to buy
  • Silver articles
    • Silver prediction 2026 – 2030
    • Can silver hit $100?
    • Silver shortage
    • 50-year silver chart
    • Silver bullish reversal
    • Silver seasonality charts
    • How to invest in silver
  • Gold
    • Gold prediction 2026 – 2031
    • Will gold set new ATH?
    • Can gold hit $10,000?
    • Gold chart 10 years
    • Gold chart 50 years
    • Gold chart 100 years
    • Gold silver ratio
    • Gold seasonality charts
  • Commodities
    • Sugar forecasts
    • Coffee forecasts
    • Nickel forecasts
    • Lithium investing
  • Crypto forecasts
    • BTC prediction 2026 – 2031
    • ETH prediction 2026 – 2031
    • SOL prediction 2026 – 2031
    • XRP prediction 2026 – 2031
    • XLM prediction 2026 – 2031
    • BNB prediction 2026 – 2031
    • ADA prediction 2026 – 2031
    • AVAX prediction 2026 – 2031
    • KAS prediction 2026 – 2031
    • NEAR prediction 2026 – 2031
    • BCH prediction 2026 – 2031
    • LINK prediction 2026 – 2031
    • DOT prediction 2026 – 2031
    • SUI prediction 2026 – 2031
    • ICP prediction 2026 – 2031
    • LTC prediction 2026 – 2031
    • STX prediction 2026 – 2031
    • DOGE prediction 2026 – 2031
    • SHIB prediction 2026 – 2031
    • PEPE prediction 2026 – 2031
    • FLOKI prediction 2026 – 2031
    • WIF prediction 2026 – 2031
    • ONDO prediction 2026 – 2031
  • News
    • Crypto news
      • Bitcoin
      • Ethereum
      • XRP
      • Solana
      • Dogecoin
      • Cardano
      • Litecoin
    • Commodities & Gold
      • Gold
      • Silver
    • Markets & Stocks
  • Premium Crypto Alerts
  • Premium services

Copyright © 2025 InvestingHaven