Investing Haven
No Result
View All Result
Gold Silver Investing >>
CRYPTO INVESTING >>
  • 2025 Forecasts
    • 10 market predictions
    • Dow Jones forecast
    • S&P 500 forecast 2025
    • Nasdaq prediction 2025
    • Best altcoins to buy
    • Best crypto to buy now
    • Which crypto will explode
    • 15 crypto forecasts 2025
    • Which precious metal to buy
  • Silver
    • Silver prediction 2025 – 2030
    • Will silver exceed $30?
    • When will silver hit $50?
    • Can silver hit $100?
    • Silver shortage
    • 50-year silver chart
    • Silver bullish reversal
    • Silver seasonality charts
    • How to invest in silver
  • Gold
    • Gold prediction 2025 – 2030
    • Will gold set new ATH?
    • Will gold hit $3,000?
    • Can gold hit $10,000?
    • Gold chart 10 years
    • Gold chart 50 years
    • Gold chart 100 years
    • Gold silver ratio
    • Gold seasonality charts
  • Commodities
    • Coffee forecasts
    • Sugar forecasts
    • Nickel forecasts
    • Lithium investing
  • Crypto forecasts
    • BTC prediction 2025 – 2030
    • ETH prediction 2025 – 2030
    • SOL prediction 2025 – 2030
    • XRP prediction 2025 – 2030
    • XLM prediction 2025 – 2030
    • BNB prediction 2025 – 2030
    • ADA prediction 2025 – 2030
    • AVAX prediction 2025 – 2030
    • KAS prediction 2025 – 2030
    • NEAR prediction 2025 – 2030
    • BCH prediction 2025 – 2030
    • LINK prediction 2025 – 2030
    • DOT prediction 2025 – 2030
    • SUI prediction 2025 – 2030
    • ICP prediction 2025 – 2030
    • LTC prediction 2025 – 2026
    • STX prediction 2025 – 2030
    • DOGE prediction 2025 – 2030
    • SHIB prediction 2025 – 2030
    • PEPE prediction 2025 – 2030
    • FLOKI prediction 2025 – 2030
    • WIF prediction 2025 – 2030
    • ONDO prediction 2025 – 2030
  • News
    • Crypto news
    • Commodities
  • Login
Investing Haven
No Result
View All Result

Home » Markets & Stocks » Japanese Nikkei 225 Index Historic Chart – A Giant Bullish Reversal

Japanese Nikkei 225 Index Historic Chart – A Giant Bullish Reversal

The Nikkei 225 historic chart over 50 years shows a giant secular pattern while the 25-year chart highlights a decision time window.

Taki T. by Taki T.
September 21, 2024
in Markets & Stocks
Nikkei 225 index
2.1k
VIEWS
Share on FacebookShare on Twitter

This article features the Nikkei 225 Index historic chart on 50, 40 and 25 years. Take-aways for investors: the next quarters until Q1/2026 mark a decision window. There is a clear and clean historic chart pattern. It helps explain whether the Nikkei 225 is an uptrend or not.

The Nikkei 225 index, a key barometer of the Japanese stock market, holds significant relevance for investors worldwide.

Understanding its historical performance through various timeframes can provide insights into potential future movements.

This article aims to analyze long-term trends using the 50-year and 40-year historical charts. It also offers short-term predictions based on the 25-year historical chart.

RELATED – More historical charts released by InvestingHaven’s research team.

Nikkei 225 Index – an overview

The Nikkei 225 is a price-weighted index that represents 225 leading companies listed on the Tokyo Stock Exchange.

It serves as a crucial indicator of the economic health of Japan and is widely followed by global investors.

Historical analysis of the Nikkei 225 helps investors understand market cycles, making it essential for strategic investment decisions.

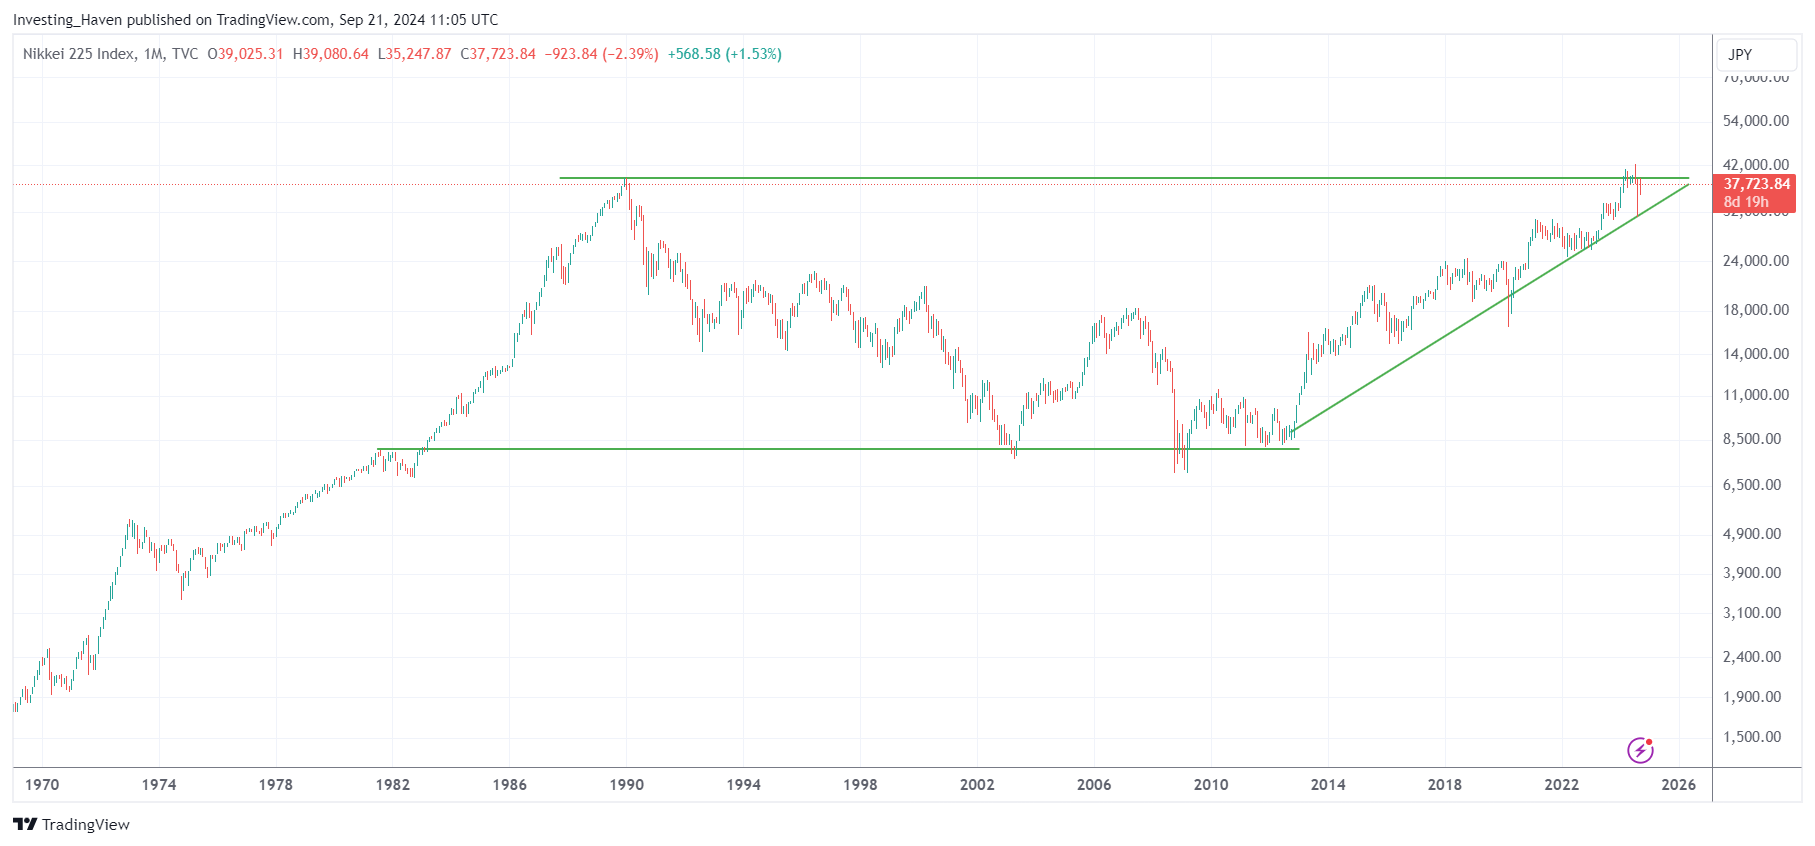
Nikkei 225 Index – historic chart on 50 years

The 50-year historical chart of the Nikkei 225 reveals significant trends and pivotal moments in the index’s history.

Notably, the late 1980s saw an extraordinary bubble, followed by a prolonged decline that characterized the 1990s. This downturn was marked by various factors, including asset price deflation and economic stagnation.

Throughout the years, the Nikkei has demonstrated resilience, with notable recoveries during significant global events, such as the recovery post-2008 financial crisis.

Understanding these patterns can provide long-term investors with valuable insights into potential future performance, particularly as the index has begun to show signs of renewed strength in recent years.

The chart pattern we observe, both on the log and non-logarithmic chart of the Japanese Nikkei 225 index, is a bullish reversal over 30 years. This 30-year bullish reversal is ‘complete’ since August 5th, 2024.

Nikkei 225 historical chart 50 years

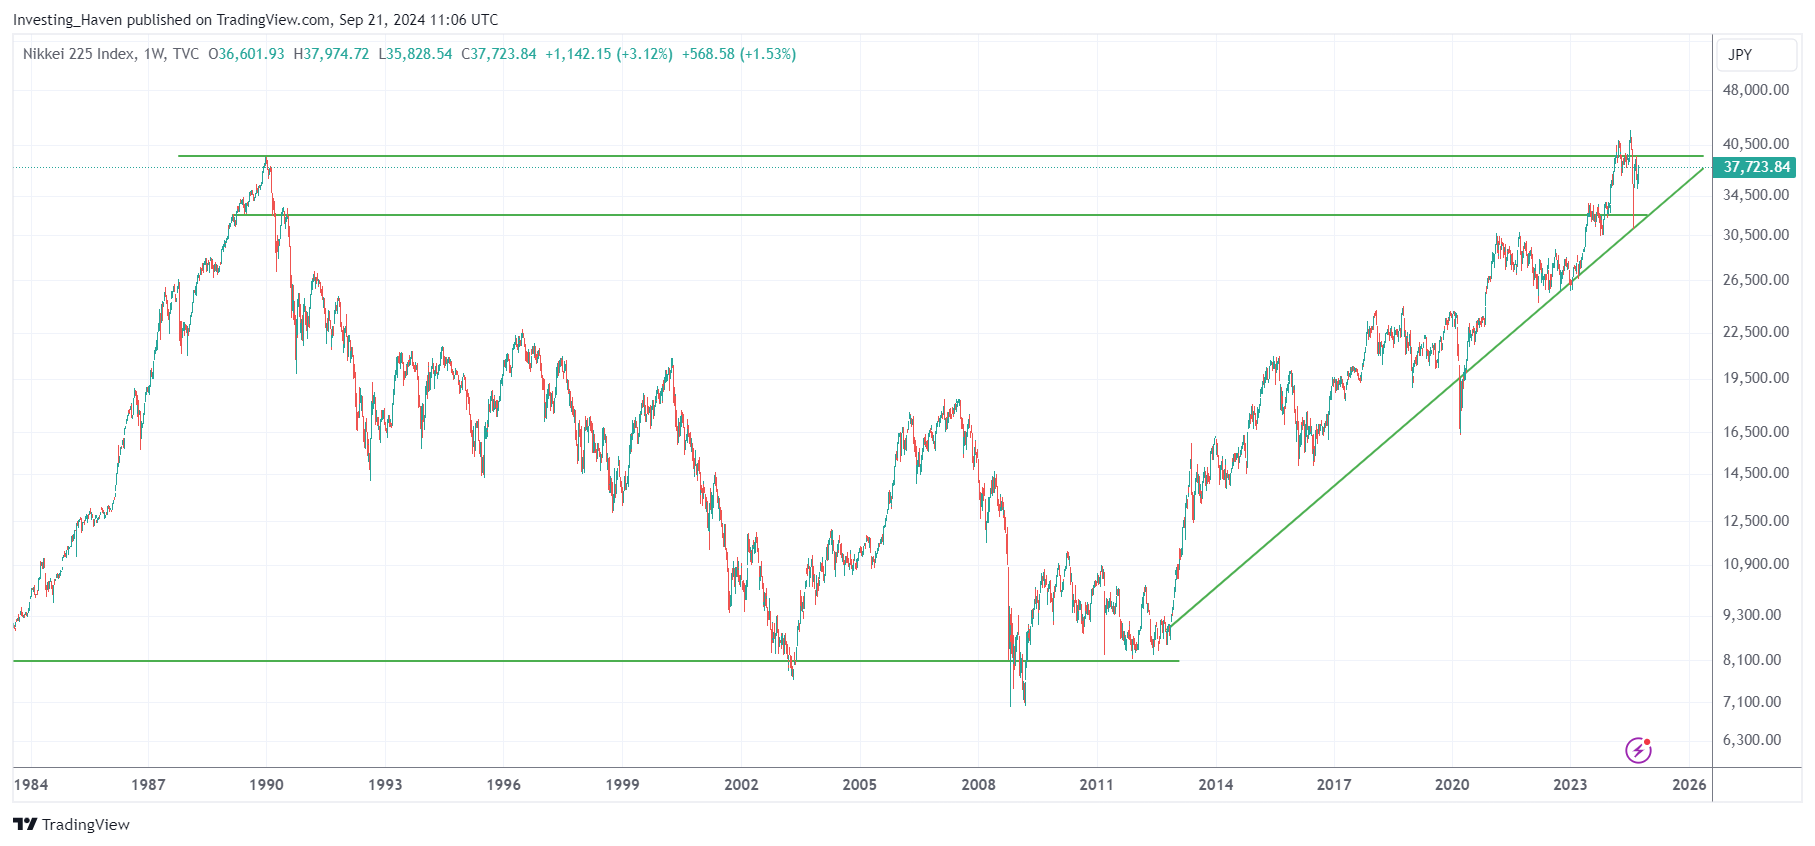
Nikkei 225 Index – historic chart on 40 years

The 40-year historical chart builds on the insights from the 50-year analysis. It emphasizes more recent trends and shifts in market dynamics.

This timeframe captures the impact of Japan’s economic policies. Monetary decisions have a direct impact on the Yen which, in turn, has an impact on the Nikkei 225.

Recent trends indicate a potential shift as Japan adapts to new economic realities, including demographic challenges and globalization.

Investors should consider these factors, as they will significantly impact the index’s performance in the years ahead.

Nikkei 225 historical chart 40 years

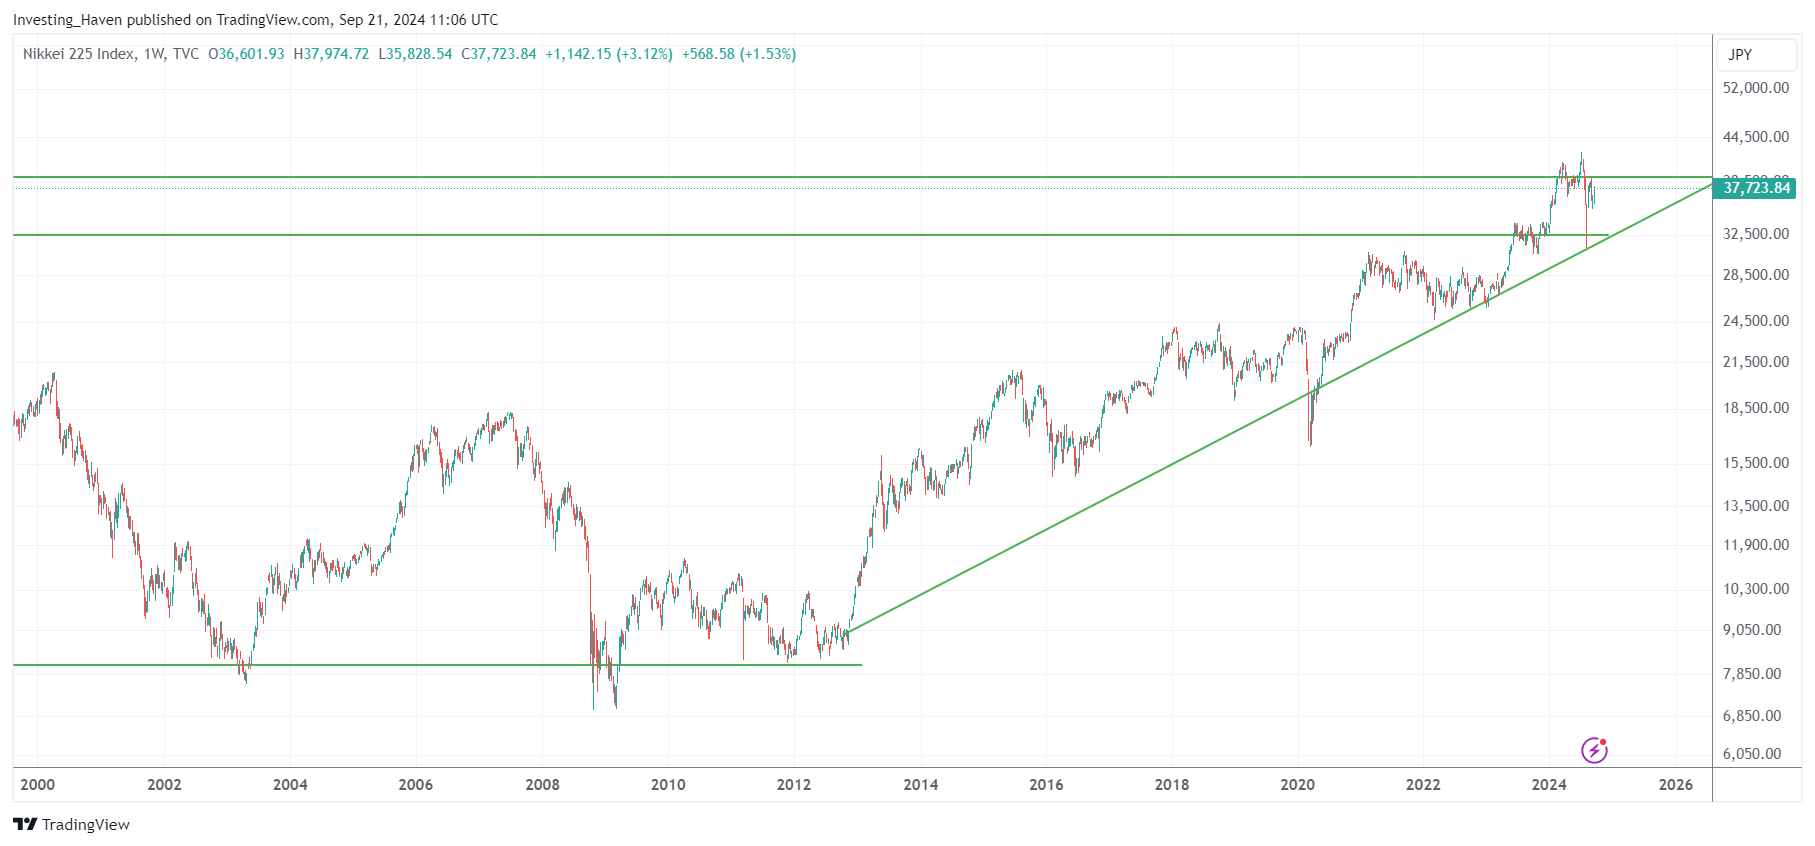
What’s next for the Nikkei 225 according to its chart

Prior to 2024, the historic Nikkei 225 chart suggests hat the index is on its way to its historic highs. ATH highs in this index were printed in the year 1989: 38,915.87 points.

In the initial iteration of this article, posted in 2022, we wrote this:

If anything, this chart pattern suggests that this index is on its way to test ATH.

In the meantime, the Nikkei 225 made a new ATH but came down significantly on what some are calling ‘Black Monday’, August 5th, 2024, when this indexed ‘crashed’ more than 10% on one day.

Focusing on the 25-year historical chart of the Nikkei 225, a significant secular pattern emerges, set to resolve within the next 18 months, not later than Q1 2026. This pattern serves as the foundation for our short-term predictions and underscores the potential for substantial market movements.

The resolution of this secular trend will hinge on several key factors:

  • Movements of the Yen: As a major driver of investor sentiment, fluctuations in the Yen will likely impact the Nikkei’s performance. A weaker Yen could boost export-driven companies, whereas a strengthening Yen might create headwinds.
  • Japan’s Central Bank monetary decisions: The Bank of Japan’s policies on interest rates and quantitative easing will play a crucial role in shaping market dynamics. Any shifts in monetary policy could significantly influence the index’s trajectory.
  • Global economic conditions: The interconnectedness of global markets means that economic developments outside Japan will also impact the Nikkei. Factors such as U.S. economic performance, trade relations, and geopolitical events will be crucial in determining the index’s direction.

Given these considerations, investors should closely monitor these variables as they will heavily influence how the Nikkei 225 evolves in the coming months.

Nikkei 225 historical chart 25 years

Considerations and take-aways

The analysis of the Nikkei 225 across different timeframes highlights the importance of understanding both long-term and short-term trends.

  • The 50-year and 40-year charts provide context for historical performance.
  • The 25-year chart offers critical insights into potential upcoming movements.

All timeframes combined point to a crucial time window (now till Q1/2026), and it helps visualizing an absolutely crucial long term (rising) trendline which will is the ‘line in the sand’ for the uptrend of the index.

In conclusion, analyzing the historical charts of the Nikkei 225 is essential for both long-term and short-term investment strategies.

By understanding the implications of past performance and current market dynamics, combined with Nikkei 225 historical chart structures, investors can make informed decisions.

10-YEAR ANNIVERSARY OFFER: InvestingHaven.com celebrates 10 years. Temporarily, you can enjoy a discount on our premium gold/silver and crypto reports. Or you can become a VIP member. Go to our anniversary deals >>
Receive our weekly newsletter.

premium service SP-500 premium service trade alerts premium service crypto teaser 

No related posts.

Tags: historical chartsNIKKEI225
Taki T.

Taki T.

Taki is a chart analyst who is passionate about unlocking unique insights out the chart. While the vast majority of analysts remain focused on price analysis, Taki starts with timeline analysis and adds price analysis to this. In doing so, he developed a unique methodology to find opportunities in financial markets, across assets and markets.

Connect with InvestingHaven

Receive top notch forecasts for free.

*We hate spam as you do.

Site Navigation

  • RSS Feed
  • About us
  • Advertising
  • Sponsored Content Policy
  • Mission 2026
  • Sitemap
  • Privacy & Disclaimer
  • Terms of Service
  • Contact Us
investing haven logo

Precious metals market analysis including gold and silver price predictions. Crypto market analysis including highly accurate BTC ETH SOL XRP forecasts.

Copyright © 2025 InvestingHaven

Login to your account below

Forgotten Password?

Fill the forms bellow to register

All fields are required. Log In

Retrieve your password

Please enter your username or email address to reset your password.

Log In

Receive top notch forecasts for free.

*We hate spam as you do.

No Result
View All Result
  • News
  • 2025 Forecasts
    • 10 market predictions
    • Dow Jones forecast 2025
    • S&P 500 forecast 2025
    • Nasdaq prediction 2025
    • Best crypto to buy now
    • Which crypto will explode
    • Best altcoins to buy
    • 15 crypto forecasts 2025
    • Which precious metal to buy
  • Silver articles
    • Silver prediction 2025 – 2030
    • Will silver exceed $30?
    • When will silver hit $50?
    • Can silver hit $100?
    • Silver shortage
    • 50-year silver chart
    • Silver bullish reversal
    • Silver seasonality charts
    • How to invest in silver
  • Gold
    • Gold prediction 2025 – 2030
    • Will gold set new ATH?
    • Will gold hit $3,000?
    • Can gold hit $10,000?
    • Gold chart 10 years
    • Gold chart 50 years
    • Gold chart 100 years
    • Gold silver ratio
    • Gold seasonality charts
  • Commodities
    • Sugar forecasts
    • Coffee forecasts
    • Nickel forecasts
    • Lithium investing
  • Crypto news
  • Crypto forecasts
    • BTC prediction 2025 – 2030
    • ETH prediction 2025 – 2030
    • SOL prediction 2025 – 2030
    • XRP prediction 2025 – 2030
    • XLM prediction 2025 – 2030
    • BNB prediction 2025 – 2030
    • ADA prediction 2025 – 2030
    • AVAX prediction 2025 – 2030
    • KAS prediction 2025 – 2030
    • NEAR prediction 2025 – 2030
    • BCH prediction 2025 – 2030
    • LINK prediction 2025 – 2030
    • DOT prediction 2025 – 2030
    • SUI prediction 2025 – 2030
    • ICP prediction 2025 – 2030
    • LTC prediction 2025 – 2026
    • STX prediction 2025 – 2030
    • DOGE prediction 2025 – 2030
    • SHIB prediction 2025 – 2030
    • PEPE prediction 2025 – 2030
    • FLOKI prediction 2025 – 2030
    • WIF prediction 2025 – 2030
    • ONDO prediction 2025 – 2030
  • Premium Crypto Alerts
  • Premium services

Copyright © 2025 InvestingHaven