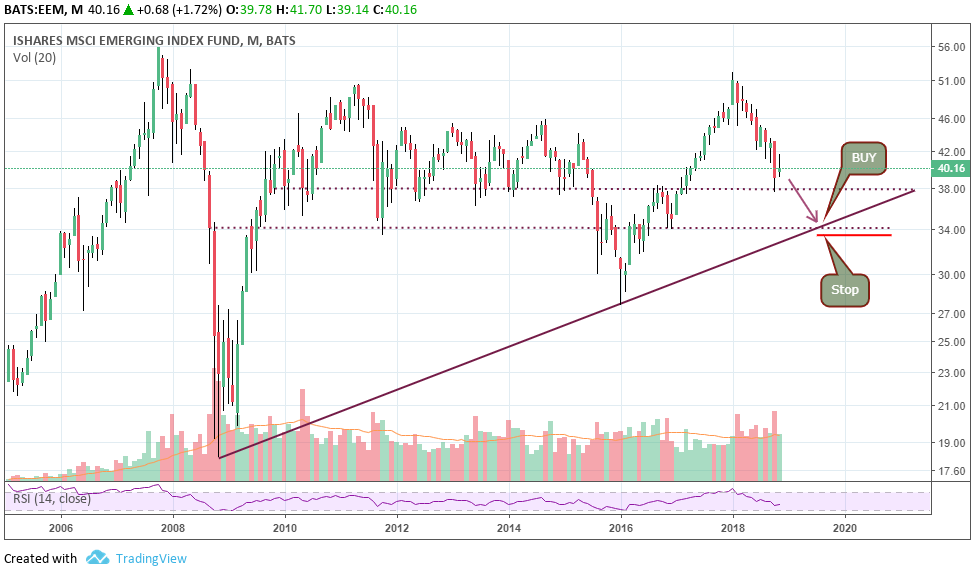
In our Emerging Markets Forecast for 2019 we identified 40 points in the emerging markets (EEM) as the proverbial ‘line in the sand’. This is still, by far, the most important price point on the emerging markets chart. How are emerging markets doing against our forecast?
Before answering the question mentioned above we have to make a point on this important success factor in realizing profits. One of the most challenging things any investor faces is being patient, and not acting too early nor too late.
Emerging markets investing is no exception to this rule.
The critical price point on the EEM ETF chart is one that might be tested for another couple of months. The most likely outcome, if this were to happen, is that investors lose track on this because they get bored. This assumes there will be a consolidation around current levels in emerging markets, and, provided there is no structural breakdown, that emerging markets will move higher at a certain point in 2019.
Moreover, financial media being bearish against emerging markets will only accelerate this process.
Our expectation outlined in our forecast mentioned before is that “we are in a normal retest of a breakout which was 9 years in the making. Unless the Euro crashes this year we believe that emerging markets will consolidate only to move higher in 2019. If this happens as expected our price target for 2019 will be 52 and, ultimately, 60 in 2020 for EEM ETF. However, if the consolidation continues for a little longer then the 36 level followed by 30 will provide support. In that case emerging markets will hit 40 to 45 in 2019 as they need more time to recover. Where is the line in the sand for our bullish forecast? Simple, as said before, EEM ETF 40 points must hold, emerging markets currencies should trade above 17.60, the Euro should not crash.”
The most up-to-date emerging markets chart is not showing any different outcome than already highlighted before. Below is the monthly chart on 10 years.
The 38 to 40 level is the one that has to hold strong. Below this level there is some downside but it should be limited (unless really exceptional circumstances take place).
This chart suggests emerging markets are a juicy play. The 36 to 38 , arguably 36 to 40 area, is a good long term entry point. For risk management purposes we believe it is a good thing to have a stop loss in the 35 to 36 points area.


