InvestingHaven followers know by now how much we focus on leading indicators. In fact, our entire investing strategy is based on a few leading indicators, and we explained this in great detail in our 100 Investing Tips For Long Term Investors. Our method has been very solid in supporting our annual market forecasts, so the proof is out there. Right now, we see one of our leading indicators signal a potential ‘risk on’ wave about to start … or, better, continue.
The leading indicator we are talking about in the context of this article is the Euro, and consequently also the USD.
Here is a small trick, that most analysts are not aware of: reading the USD chart is not necessarily as powerful as reading the EUR chart.
How comes, as in the end it is a currency pair?
The answer is that the EUR chart has a much outspoken setup when it comes to trends and patterns. In other words it is easier to forecast by using the EUR chart than the USD chart!
But we *always* have to check both, individually and against each other, to get a very clear view.
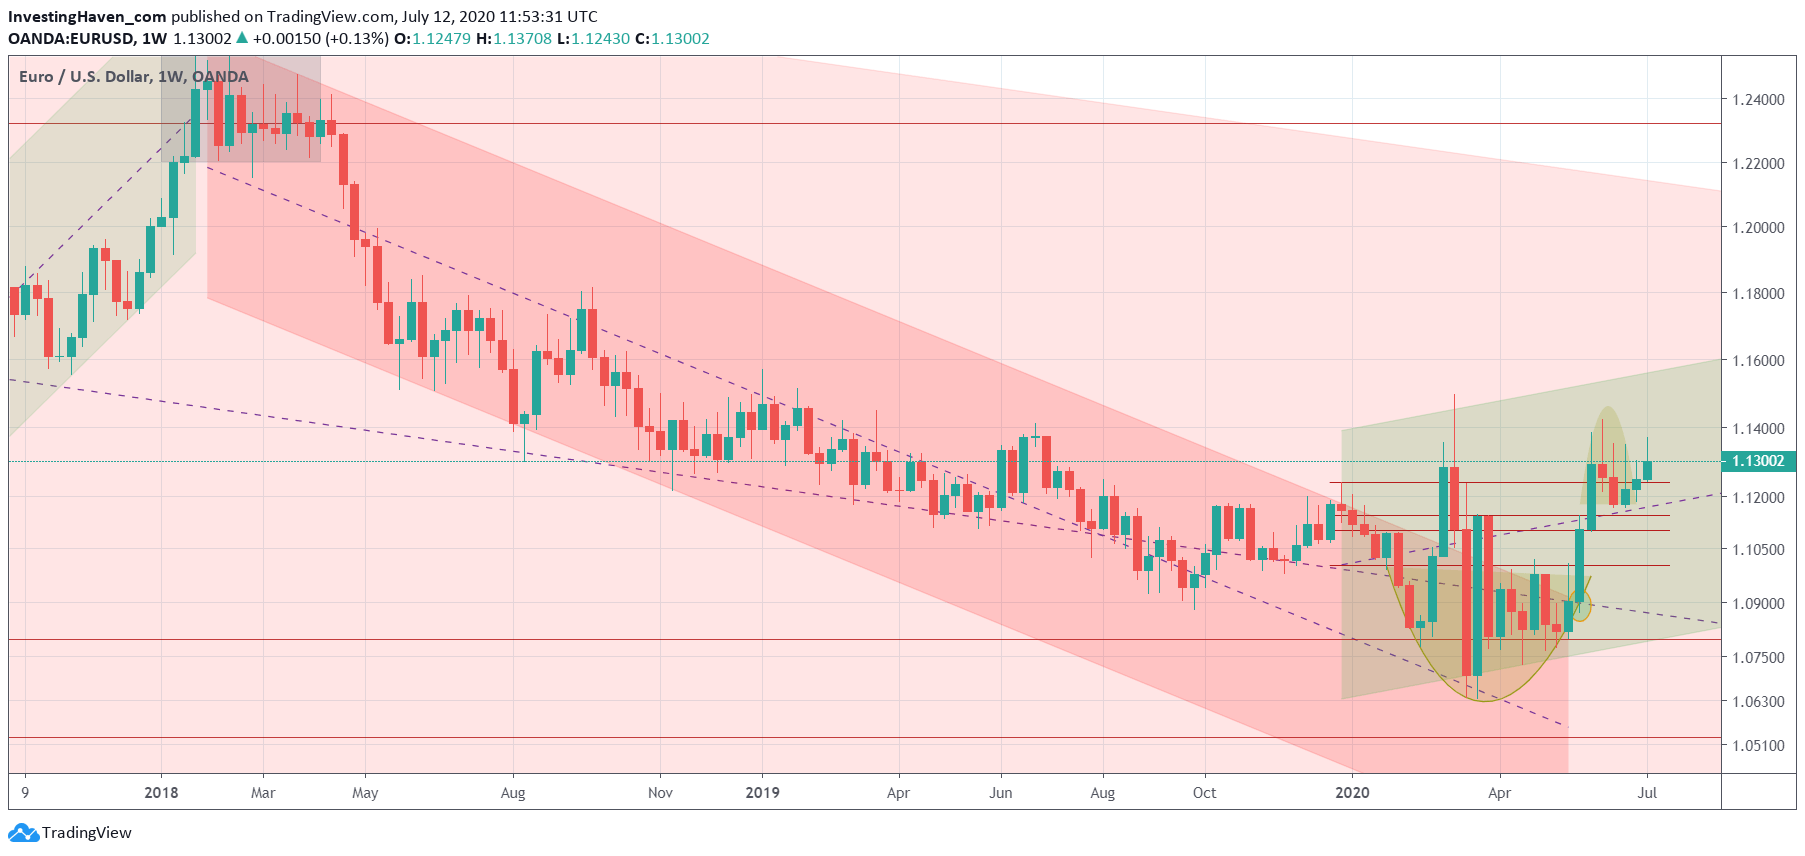
The EUR chart is absolutely gorgeous!
It shows the new bullish trend in play, see new green rising channel on the first chart below.
Moreover, and equally important, it respected the 1.125 level which we indicated with a horizontal red line on below chart. We see a nice short term bullish setup now, which leads us to conclude that ‘risk on’ is returning to markets and because of this commodities will get a bid.

The USD chart should reflect this as well, right?
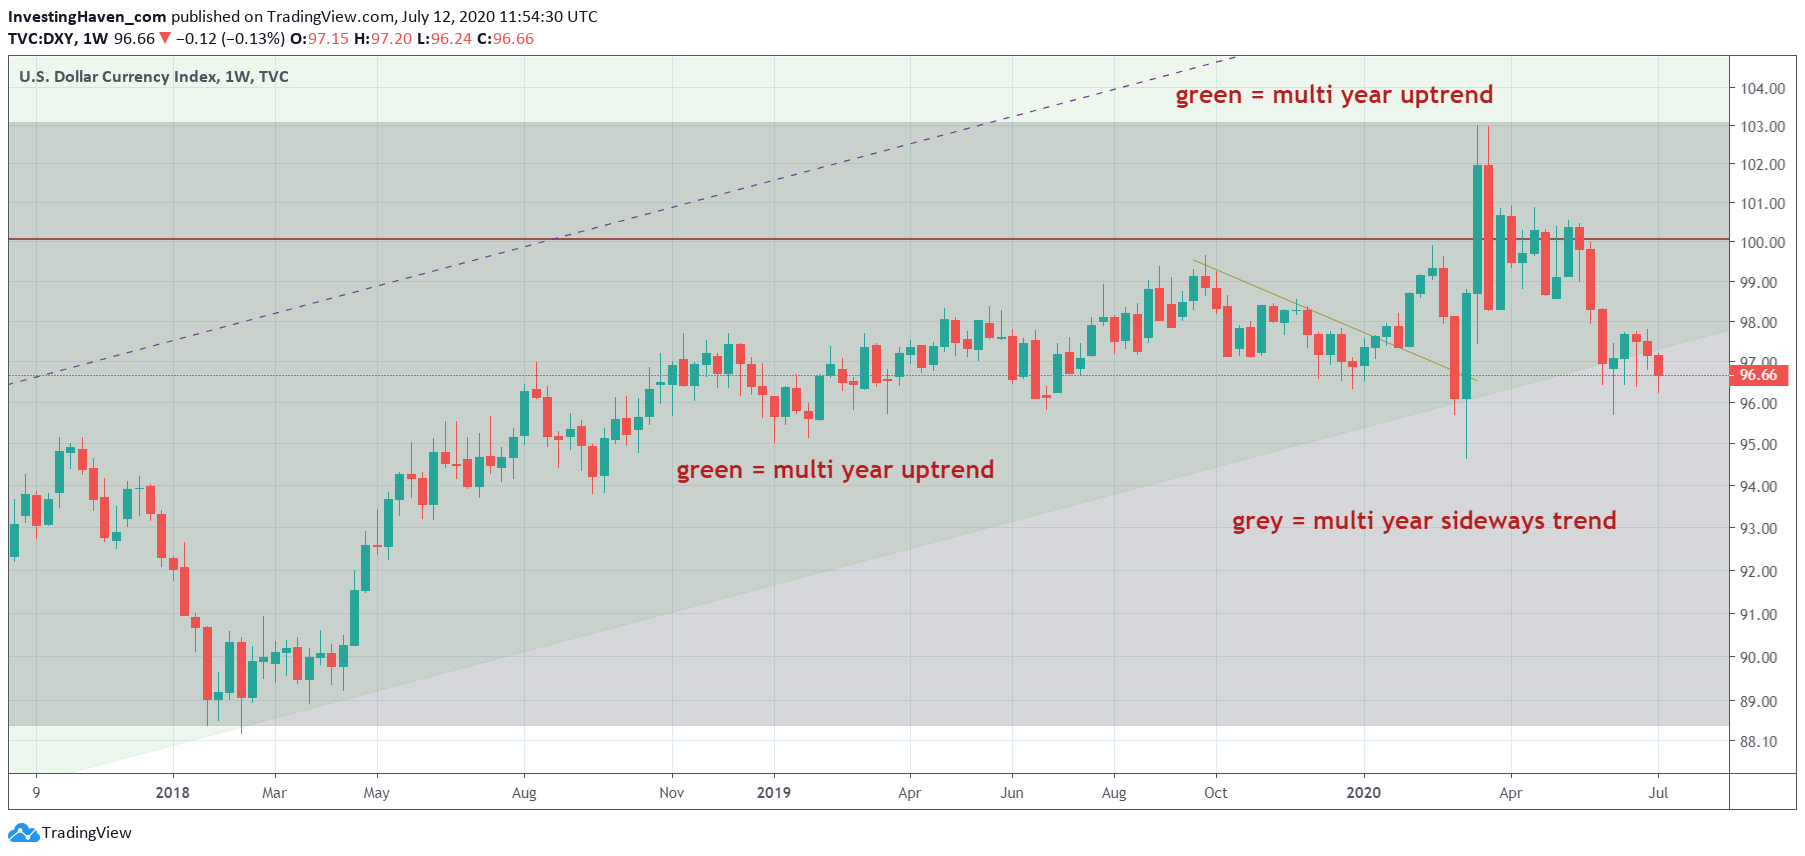
It does, the USD has a very ugly breakdown scenario in play now.
Note that the weekly chart has essentially only 2 trends: a sideways trend (grey color) and a long term rising trend (green color).
The overlap between green and grey is where the USD is trading in right now. And it is about to fall below its bullish channel. This is GOOD for stocks, and more so for inflation sensitive assets like gold, silver and commodities in general.


