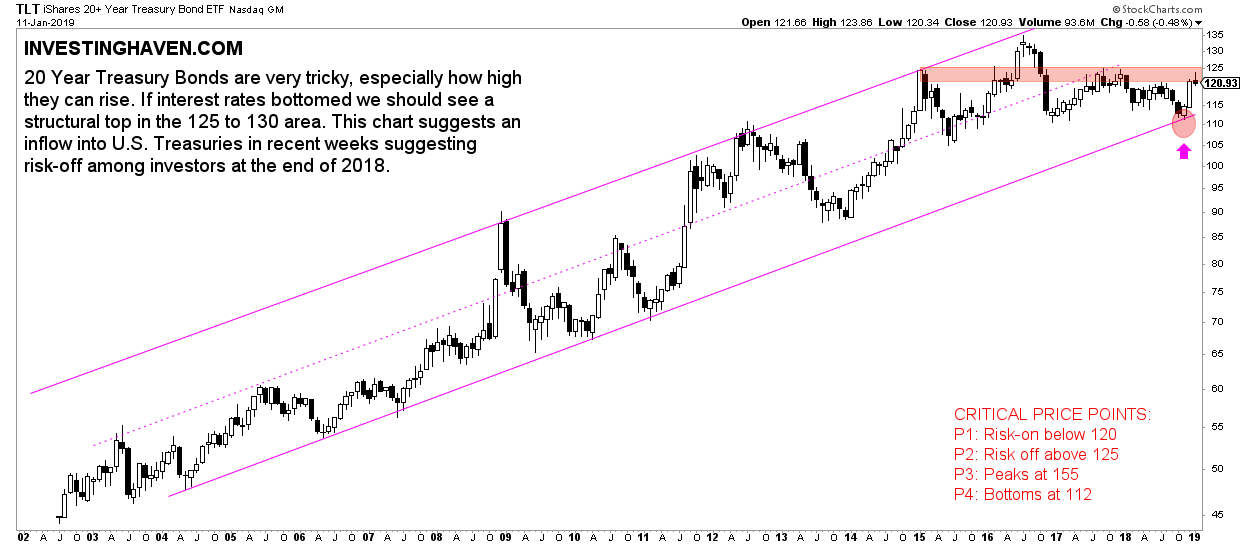
We just finished our brand new section which features how InvestingHaven’s research team forecasts markets. Based on just 15 leading indicators we identify the dominant trend(s) in global markets. While researching we have found especially one chart that needs attention: 20-year Treasuries in the U.S. This qualifies as the most scary chart of 2019.
InvestingHaven’s research team has a very strict method when it comes to understanding the dominant market trend. As per our ‘intermarket dynamics’ viewpoint capital flows between assets. So charts highlight which assets get an influx and which ones fall victim of capital outflows.
As explained in our 100 tips for successful long term investing:
When leading assets arrive at decision levels they can do either of three things. Either they break out, they break down or bounce back. In doing so, they influence other assets. This is the basis for a new market trend where several markets are part of a similar type of trend.
In researching the new trend(s) of markets we know that currencies and credit markets are the most important place to look for major turning points in markets. They have determined major changes in the last decades, and they revealed ahead of time the major stock market crashes.
In January 2019 we see the following picture in currencies and credit markets:
The Euro seems to have found support at 114. Similarly, 10 year Treasuries in the U.S. seem to have found support above 2.60. Any break below both levels would spell more turmoil ahead for risk assets, especially stock markets.
The most scary chart though is 20-year Treasuries, not the rates but the bond prices. As shown below the line in the sand is 125: above 125 it will suggest a strong risk-off sentiment as capital would be flowing massively into Treasuries.
As seen on the chart 20-year Treasuries stopped rising at major support. The million dollar question is what’s next. We are at a major decision point. Note the small area between support at 112 and resistance at 120. Something major is about to happen in 2019!


