
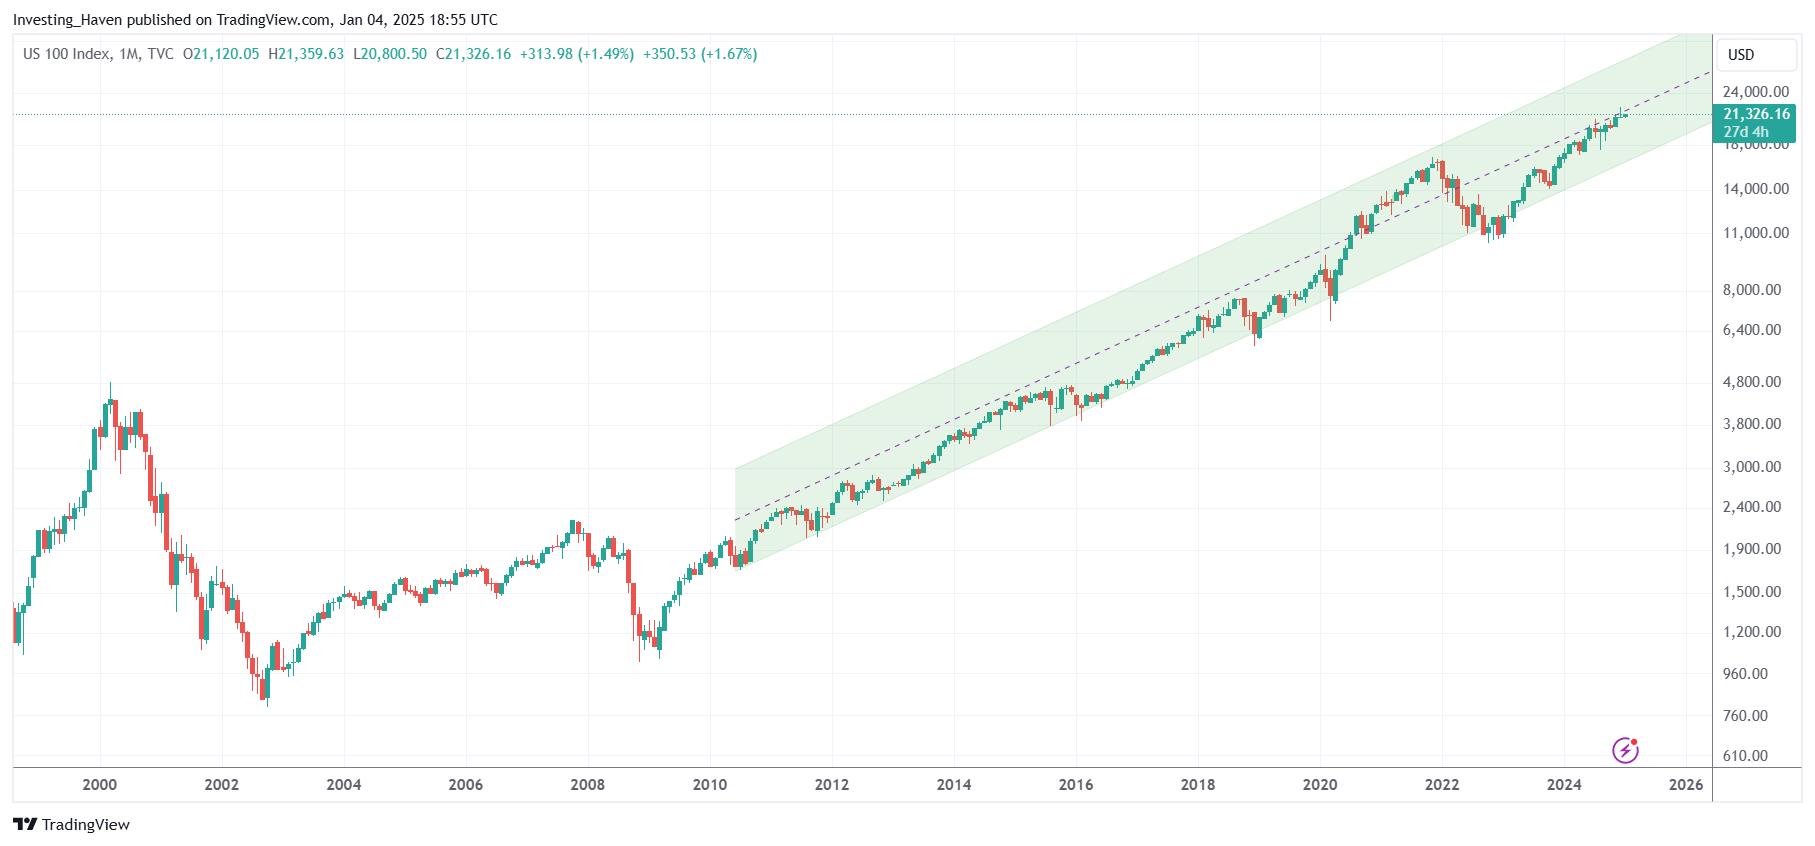
More specifically, according to the chart dynamics on the 20-year Nasdaq chart, the Nasdaq 100 Index is predicted to move in a range between 18,100 and 24,200 points in 2025.
RELATED – Our 2025 market predictions.
Historical charts can help investors predict target areas on a 12 to 18 month period, especially and specifically if chart patterns are dominant and clear/clean.
When it comes to the Nasdaq 100 Index, there is a very clear and clean chart pattern on its secular timeframe: the Nasdaq 20-year chart.
A bullish Nasdaq prediction for 2025
The chart pattern that can help us predict what the Nasdaq may do in 2025 is the long term channel.
Note – it’s not the news (lagging), but rather the chart (leading) that can help make predictions.
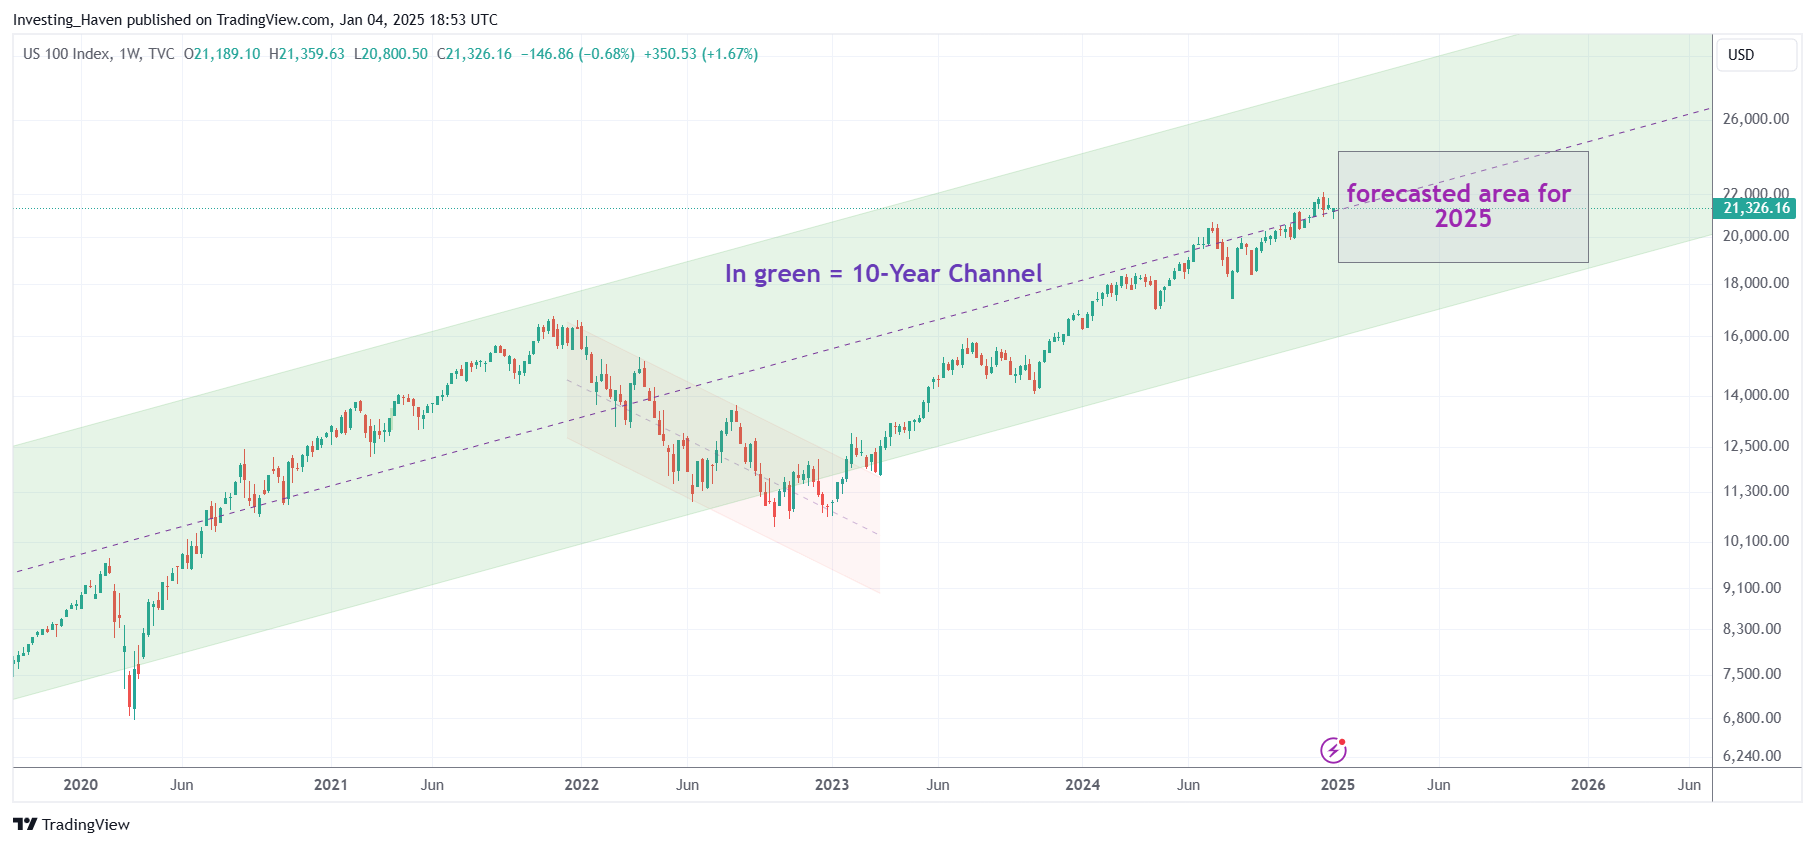
This channel is visualized on its 5-year chart shown below.
More importantly, Nasdaq’s rising chart pattern that goes back 13 years in time which makes it so special and unique. Consequently, because of the length of this pattern, it is also strong and tough to break this trend.
The 20-year Nasdaq chart the next chart view gives a very obvious outcome for 2025:
- Predicted lows for 2025: the recent August lows around 17,500 points.
- Predicted highs for 2025: the median of the long term rising channel around 23,500 points.
Validation of our Nasdaq 2025 prediction: as long as the rising pattern is respected, the price points above have a high reliability. In other words, support of the rising channel must hold whenever markets will come under pressure.
The 5-year Nasdaq chart
The 5-year Nasdaq chart offers a panoramic view of the index’s evolution: a 10-year rising channel. This also justifies a bullish Nasdaq forecast for 2025.
A closer examination of this chart unveils several noteworthy aspects that provide valuable insights for investors:
- Firstly, the chart showcases the Nasdaq’s remarkable ability to rebound from significant downturns. Over the past two decades, the index has weathered multiple crises, including the dot-com bubble burst and the global financial crisis. In each instance, the Nasdaq not only recovered but continued to set new highs. This resilience explains the underlying strength of the tech sector and its capacity to lead market recoveries.
- Furthermore, the chart reveals distinct bullish trends characterized by successive higher highs and higher lows.
These trends reflect sustained periods of investor optimism and buying interest, often driven by groundbreaking technological advancements.
January 4th – The predicted range for the Nasdaq 100 Index in 2025 is 18,100 to 24,200. This forecast is derived from the rising channel on the 20-year Nasdaq chart.
Two chart patterns on the 20-Year Nasdaq Chart
We look at chart patterns visible on the 20-year Nasdaq chart based on our own chart annotations.
The Nasdaq chart on 20 years reveals 2 distinct periods:
- The period between 2002 and 2012 characterized by wild swings. This period morphed into a long term chart pattern which took the form of a W-reversal, a powerful bullish pattern.
- The period between 2012 and 2024 characterized by an uptrend. The chart pattern is the rising channel.
The latter is an unusually long period for this type of chart pattern. This makes the Nasdaq prediction for 2025, with a predicted low of 17,500 and high of 23,500, also pretty obvious.
Additionally, the dominant pattern in the last 10 years, since 2012, accentuates the significance of pivotal moments, such as the COVID-19 pandemic. The sharp decline in early 2020 followed by an equally swift recovery showcases the Nasdaq’s ability to respect the rising channel on its 20-year chart.
This adaptability is rooted in the resilience of tech companies that can pivot quickly in response to changing consumer behaviors and market dynamics.
January 4th – The long term uptrend remains intact as 2025 kicks off. Downside seems limited.
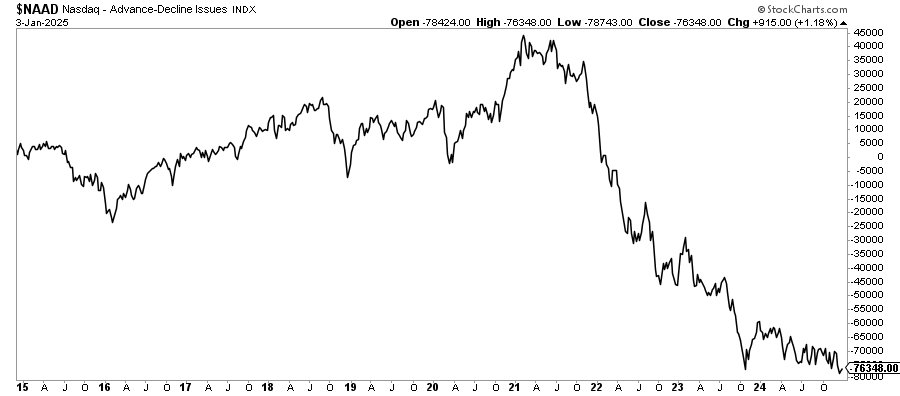
Bi-furcated participation in the Nasdaq
The rising channel visible on the 20-year Nasdaq chart suggests a steady and predictable increase in the index’s value, which might lead some to believe that all tech stocks have been performing well during this period. This perception has been wrong in recent years, but might be changing going forward. We are talking about ‘bad breadth’ in the Nasdaq index.
While the overall index has performed well, it’s important to understand that not all tech stocks have shared in this success. The rising channel of the NASDAQ can create the illusion that the entire sector is thriving. In reality, the performance of individual tech stocks has been very divergent.
Some tech stocks have experienced tremendous growth, while others have struggled or even declined.
Several tech giants have led the charge, seeing their stock prices increase dramatically. For instance, companies like Apple, Google, and Tesla have benefited from strong earnings, innovative products, and robust market demand. These success stories have had a significant impact on the NASDAQ’s rising channel.
However, not all tech stocks have enjoyed such positive results. Many tech companies have faced significant challenges. Some have struggled with profitability, faced intense competition, or failed to meet investor expectations. As a result, their stock prices have stagnated or even dropped, despite the overall upward trend in the NASDAQ index.
All of the above is reflected in a different view on the Nasdaq over 20 years, i.e. advancing minus declining issues within the Nasdaq index, chart shown below. This is a breadth indicator which turned very negative in 2022.
The good news, however, is that the deterioration in breadth is stalling. This justifies a bullish outlook for the Nasdaq in 2025, with broader participation among tech stocks than narrow leadership seen in a few stocks in recent years.
Long-Term Investment Strategies
Long-term investment strategies thrive on a thorough understanding of historical patterns and future projections.
Insights from the Nasdaq’s long-term chart allow investors to make informed decisions that align with their risk tolerance.
The ability to identify trends, potential entry points, and emerging sectors positions investors for success in a fast changing market environment.
Conclusion
The Nasdaq’s long-term chart serves as a treasure of insights for investors. The historical trends matter today and in the future, recognizing the tech sector’s dominance.
Going forward, investors can define and design well-informed strategies as long as they respect the dominant market trend visible on the long term chart(s).


