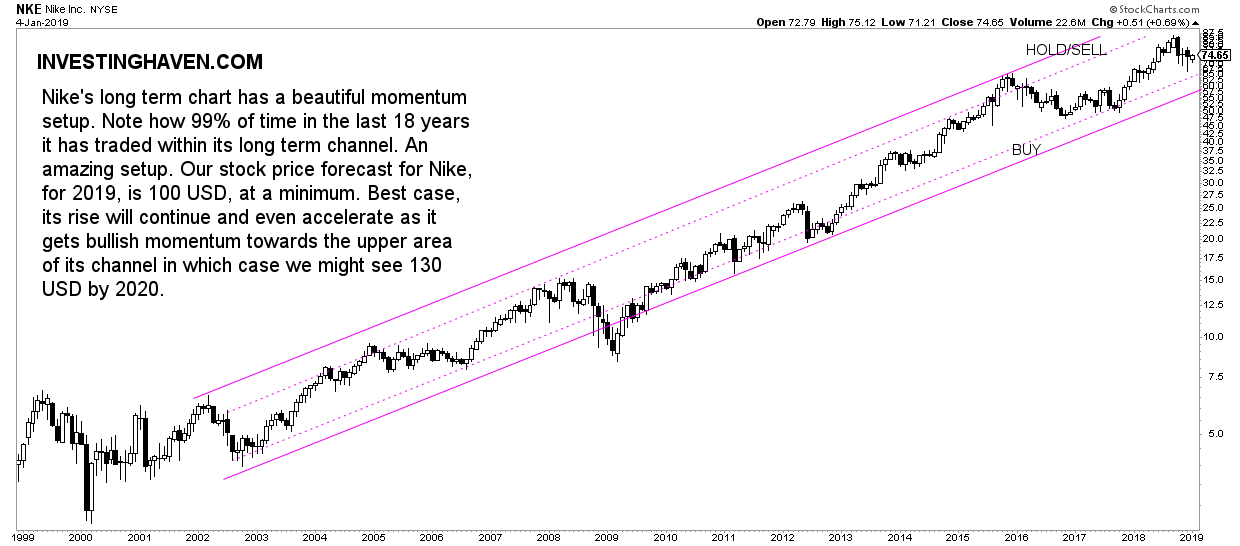
As per our Nike stock forecast 2019 we tipped Nike (NKE) as one of our 5 top stocks for 2019. How is this stock developing given the recent global market turmoil? In sum Nike has held up pretty well, and is now very close to a major buy signal. Each stock, also Nike, is subject to the dominant trend in our 15 leading indicators and dominant market trends.
Some 5 months ago we looked at fundamentals of Nike, analyzed financials and identified the dominant pattern on the long term chart of Nike. This is what we concluded after a decent analysis.
We see that a bullish Nike stock forecast for 2019 and beyond is not only confirmed by its chart pattern but also by its financials and fundamentals. This leaves us with a high level confidence forecast of $100 by 2019, and, most likely, unless a crash takes place in broad markets, $130 by 2020.
This article follows up from the previous forecast. We are not going to dig as deep as in our previous Nike stock article, but we want primarily understand how relative strength was of Nike in the recent downturn and market turmoil.
Visibly, Nike has held up pretty well, we would even say surprisingly well, given the very volatile circumstances. It retraced from $85 to 68, top to bottom since September, after which it stabilized around $74 last week.
More importantly, on its long term chart, there is no harm done whatsoever when it comes to the dominant pattern. The beautiful long term momentum pattern is still in play, and the support area was even not tested, far from it.
We would conclude this short article that, based on the long term chart, Nike might test its support (dotted line) between 67 and 69 USD one more time, depending on how the market turmoil evolves. If and once it does so we would consider this a strong buy signal for Nike’s stock!


