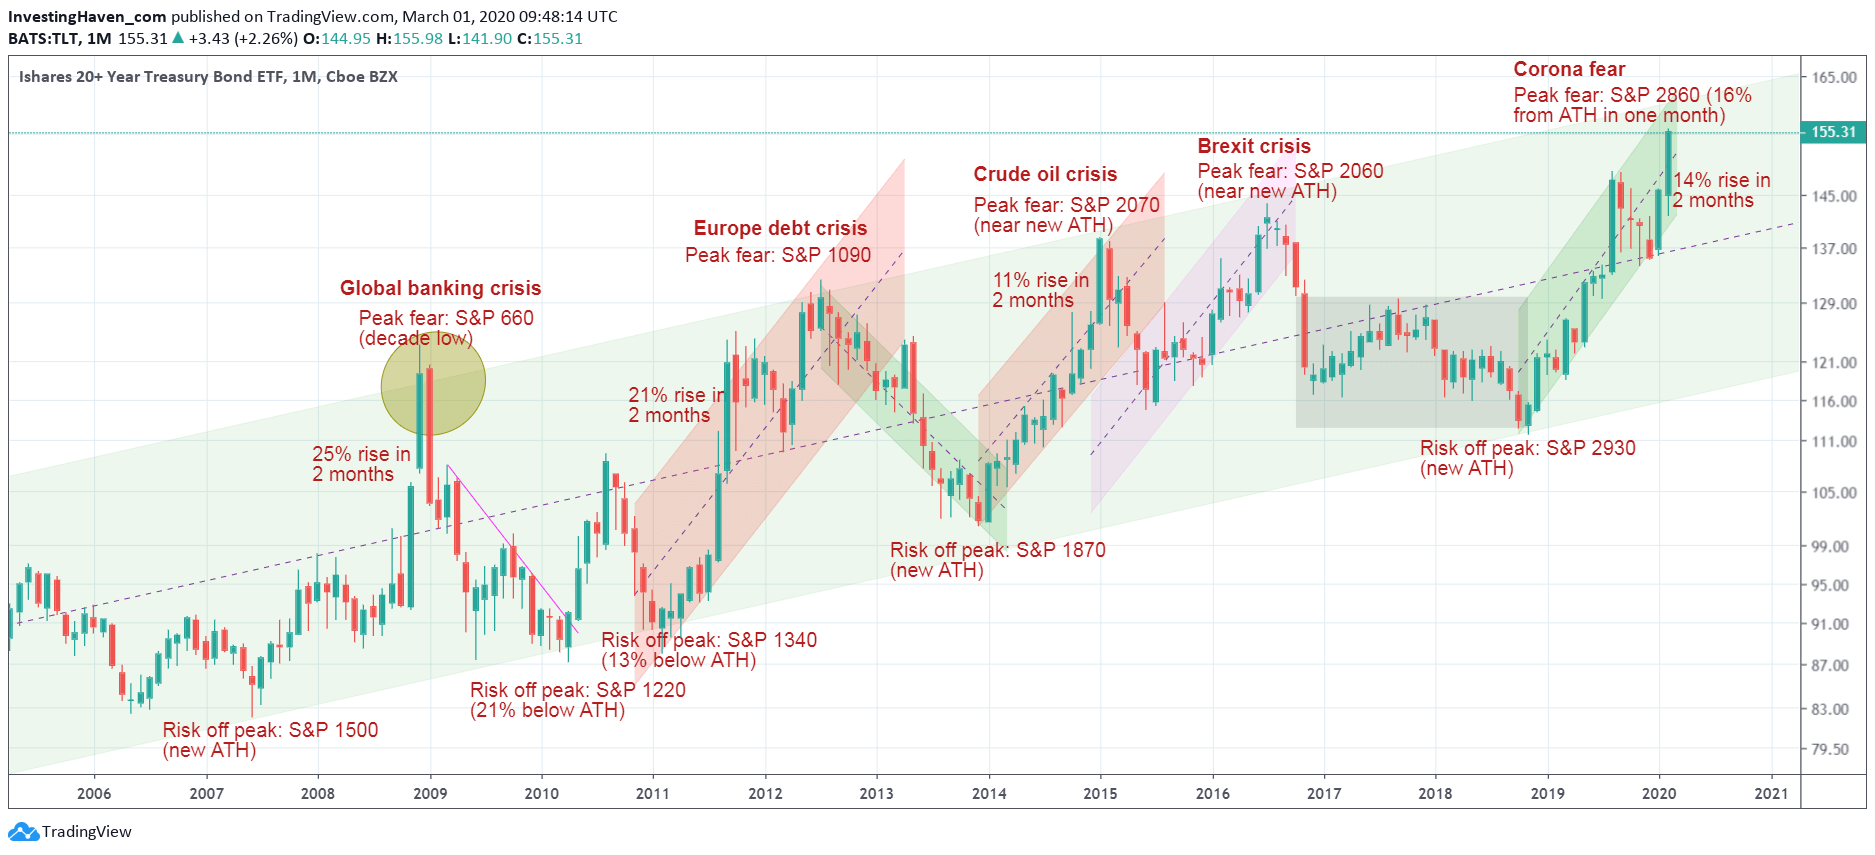
This is peak fear for the 5th time in 11 years. ‘Peak fear’ is a term that comes from analyzing our charts as per our forecasting methodology. ‘Peak fear’ are the ‘events’ of 20 year Treasuries testing their multi-decade long channel. This coincides with massive fear hitting the majority of investors, but it also coincides with a short/medium term top, sometimes a long term top, in fear.
We said it before in our 4 Must-See Global Crash Charts update.
Corona may have played a role in last week’s historic sell off. However it is certainly not THE reason, and there certainly is no correlation between the extent of this virus going viral and the depth of markets selling off.
We are on record saying that we have reached limits of the sell off. There is some downside, but not immediate.
Watch out with narratives. This week media were able to brainwash the narrative of the correlation between corona and global market selling in the brain of a massive number of investors. While recent selling might be the beginning, it does not tell anything about how and when it will accelerate.
Many investors will sell now.
Essentially there are 2 paths going forward:
- Best case: selling is over. A big rebound starts now. Investors wait until the rebound is ‘confirmed’, only to get in once markets are 10 pct higher. With the next small sell off every one wants to protect the small profits, and continues to chase prices lower and higher. This continues until investors give up, disappointed.
- Worst case: selling is not over, but continues at a later point in time. A big rebound starts now. Investors wait until the rebound is ‘confirmed’, only to get in once markets are 10 pct higher and there is hardly any profit. That’s when the next wave of selling may start.
The point we want to make with below chart is that Treasuries inflows pushed the price of TLT 14% higher in just 2 months. This is historically among the best (worst) performances. Only the European debt crisis in 2011 and the global banking crisis in 2008 did better.
Every time the TLT hits the top of its secular channel we know conditions will ease, and fear will fade away. Whether this time will be different remains to be seen.

At InvestingHaven we follow these developments very closely. One thing we were able to this uncover this week is the way to forecast this type of mini crash with a mix of technical analysis, chart analysis, trend analysis, and data analysis. We are ready to identify this whenever this happens again in the future, potentially around or after summer time or in the coming years. We’ll be able to profit from this in a way only 1% of investors are able to do.


