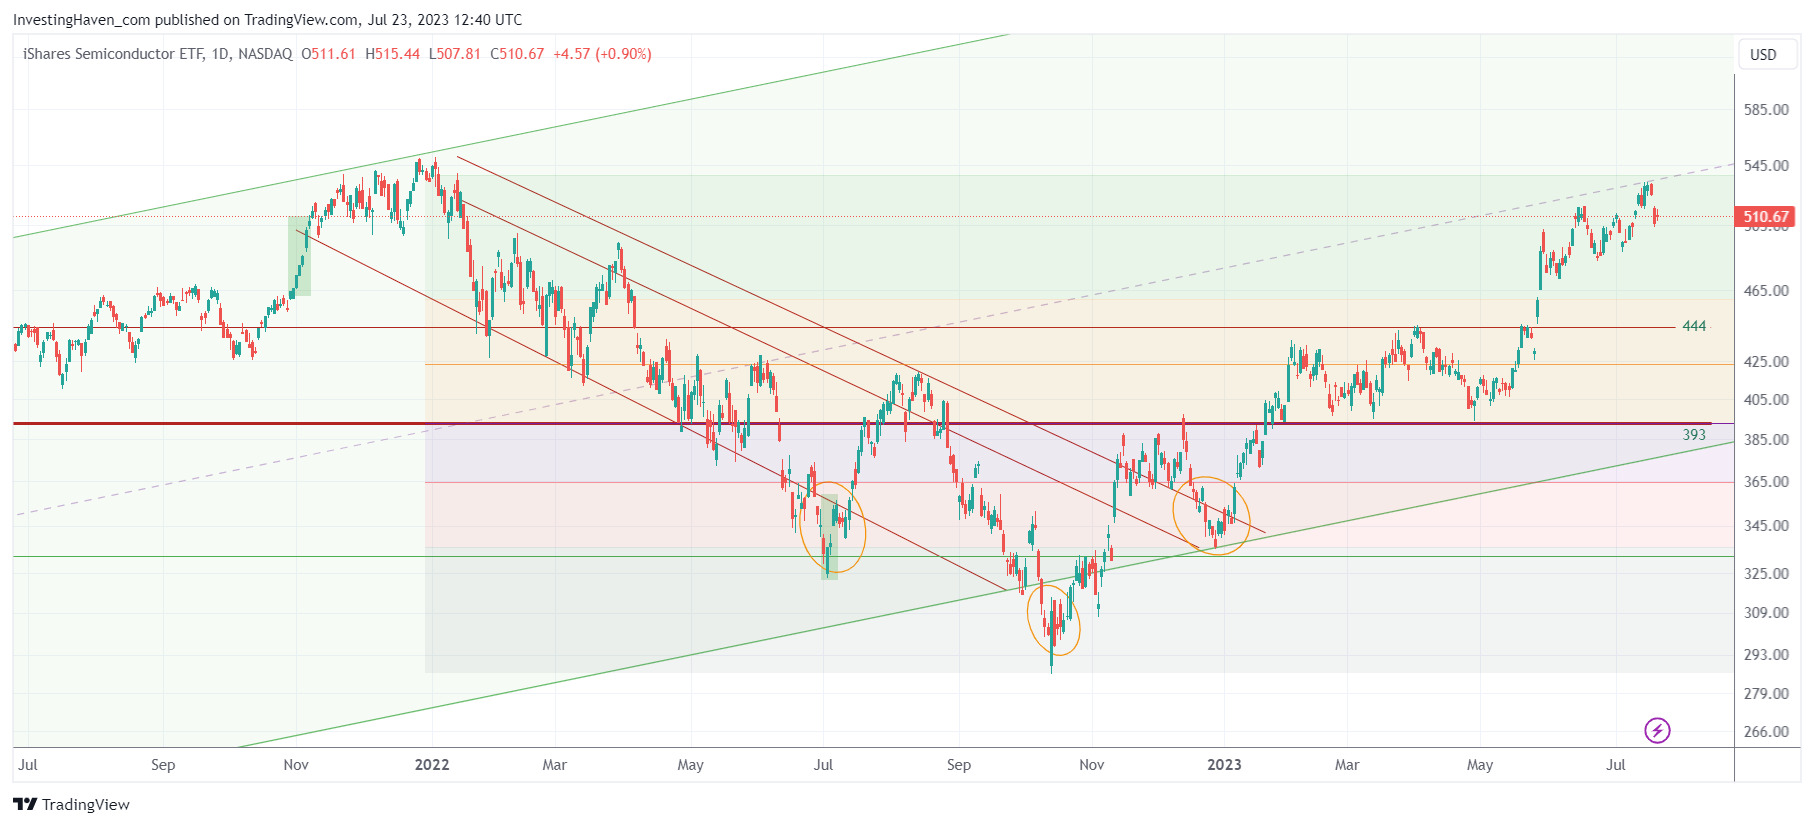
Semiconductor stocks, as per sector ETF SOXX, performed quite well. However, it has been a minority of semis that pushed the sector ETF higher. Still, as a long term investment, we like semiconductors. In this comprehensive guide, we will explore how the Rule of Three can empower your investing methodology for semiconductor stocks. This article is not really a forecast, although it leverages some of our 2023 forecasts. It really is an article that summarizes a structured way of looking at a potential investing opportunity.
By the end of this article, you’ll get a glimpse into our way of thinking: leading indicators, sector trends, and volatility windows. This is the framework we use to derive investment decisions. It is easy to generalize our framework on how we think about markets, how we look at markets, and how we come to conclusions about sectors we want to be exposed to.
1. Leading Indicators: Illuminating the Path
Leading indicators serve as guiding beacons to navigate the semiconductor market’s uncertainties. Three crucial leading indicators to consider are:
a. Nasdaq: A Key Indicator. The tech-heavy Nasdaq index often acts as a reliable leading indicator for semiconductor stocks. The long term uptrend in the Nasdaq index is confirmed, and it will continue to create a supportive environment for semiconductor companies to thrive.
b. USD Consolidation: Currency Impact. The consolidation of the US dollar can significantly influence semiconductor stocks, especially those with global operations. A steady USD can create a favorable climate for risk assets in general, and for semiconductor companies in particular.
c. Yields Topping: Market Sentiment. Topping yields can signal a potential shift in investor sentiment. Investors can turn to growth sectors like technology, including semiconductors, if yields won’t be able to rise much higher from here (which is what we expect).
2. Sector Analysis: Riding the Wave of Growth
A thorough sector analysis is essential to understand the semiconductor market’s long-term trajectory. Here are key considerations:
a. Long-Term Uptrend: A Positive Outlook. The semiconductor sector has shown a long-term uptrend, driven by technological advancements and increasing demand for semiconductor chips. The chart, as seen below, has confirmed a long term bullish reversal.
b. Hiccups on the Way: Be Prepared. Short-term volatility and market corrections can be expected. Our charts highlight key levels with colors. Be prepared for potential challenges, and be prepared to buy at the lower support levels (indicated by the areas with different colors). The key highlight, when thinking of the declining structures on the chart, is that there is no structural downtrend. There will only be tactical pullbacks, in the foreseeable future. Buy the dip is justified.
c. Sector insights: Remember that the semiconductor sector is interconnected with other technology sectors. Overall, we start seeing signs of improving breadth in technology. It’s a very slow process. Let’s put it this way: as long as we don’t see contraction in terms of breadth in tech stocks, we believe that SOXX ETF will continue to do well over a longer period of time.
3. Volatility Windows: Opportunities Amidst Turbulence
Volatility windows are periods of increased market turbulence that can offer opportunities and challenges. Here’s how to approach them:
a. September Volatility Window: Tread Carefully. The approaching volatility window in September demands caution. While it may bring turbulence, it can also create opportunities for astute investors.
b. Pullback Thesis: Steady Hands. Based on our analysis, a pullback is more likely than a complete turning point during this volatility window. Maintain steady hands and avoid knee-jerk reactions to short-term market fluctuations.
Conclusion
This is how we apply what we call the ‘Rule of Three’ when looking at the semiconductor market as an investing opportunity. By focusing on leading indicators, conducting a thorough sector analysis, and understanding volatility windows, we believe it is fair to say that (a) semis started a long term uptrend (b) pullbacks can be bought (c) the first next pullback is expected in September (d) we have clear support levels on the chart.
As you venture forth in the semiconductor market, you can make use of the AI semis that we analyzed as part of our in-depth report AI & Robotics: 30 Top Stocks For Long Term Portfolios >>


