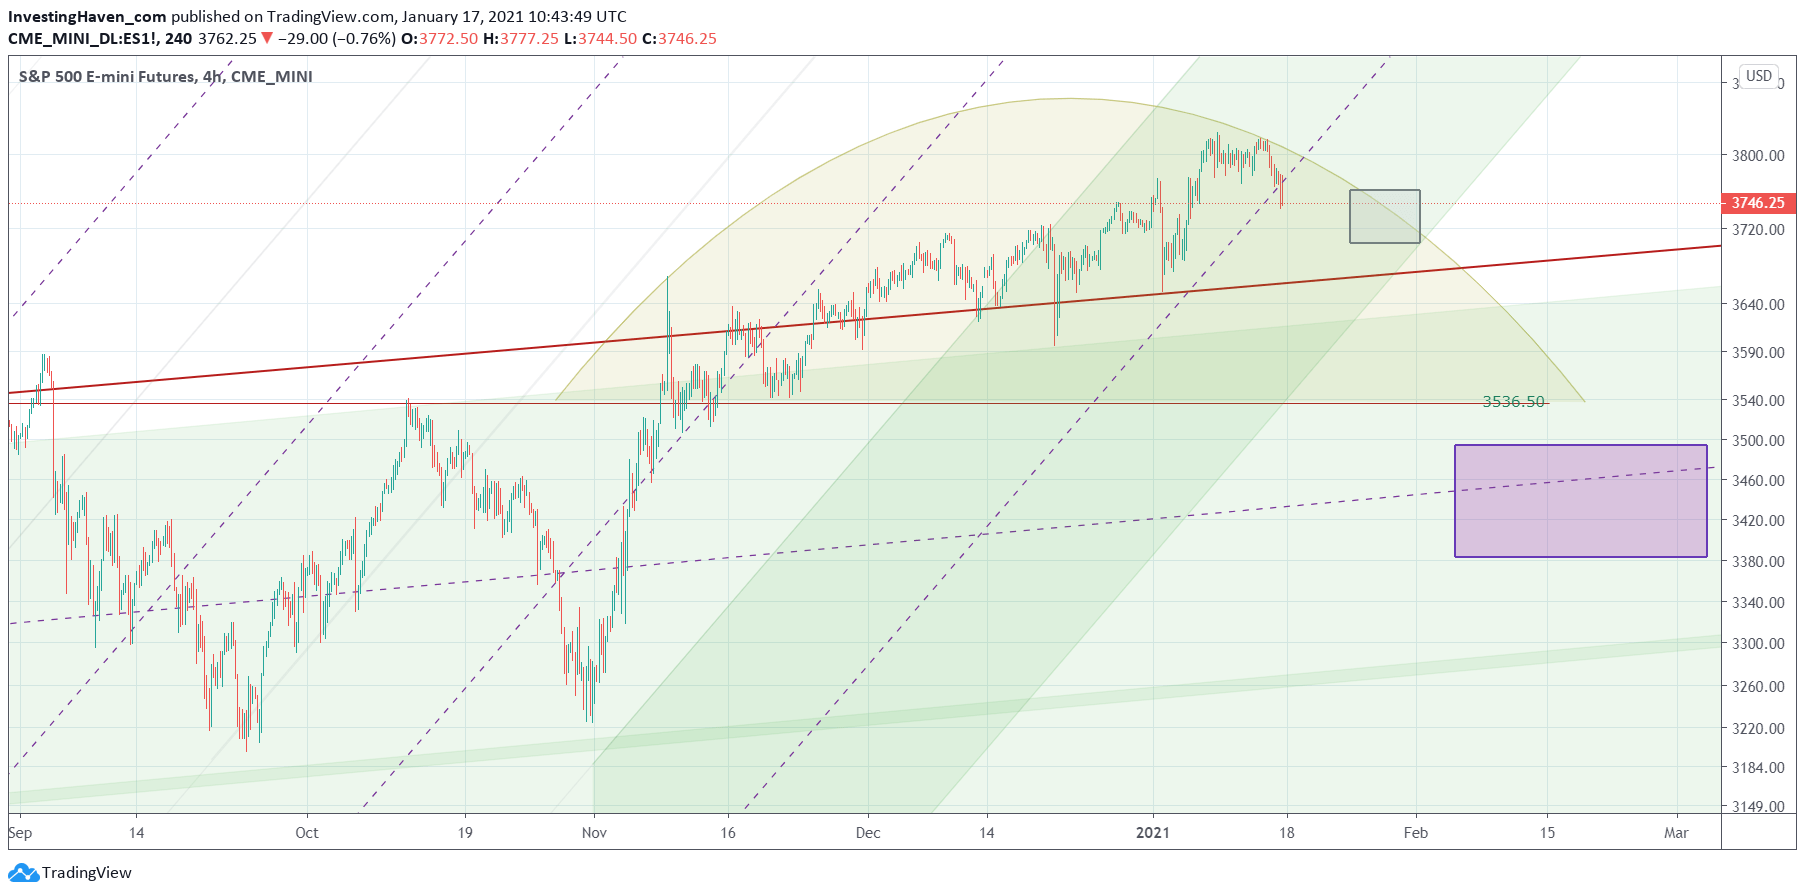
It looks like the S&P 500 is setting a medium term top. This is confirmed by a topping pattern in the Russell 2000 and a Dollar eager to move higher. A medium term top in stocks was set last week, presumably.
Last week we wrote this in our update The Make Or Break Week In Stock Markets:
A make or break week, and a good outcome will push stocks really higher in January. The opposite is true as well, and a retracement might start mildly or wildly, it will depend.
We added a few bullet points to understand how we interpret our leading crash indicator (VIX):
- Once VIX falls below 21.56 points, for 3 consecutive days, we’ll have a strongly bullish stock market in the near term.
- VIX might refuse to move lower, in which case stocks might consolidate around current levels. They will have a bullish bias, but the upside potential of indexes will be capped.
We said: “Depending on whether it is scenario 1 or 2 (above) that plays out it will help us understand how selective we have to be with stock picking … but also how defensive/offensive we have to be with stop losses.”
We got the answer from the market: VIX refused to go lower, it validated the long term reversal pattern and suggests that stocks will get under pressure now.
This conclusion is confirmed by the pattern on the S&P 500 chart, the one shown below.
Moreover, from an intermarket perspective, we do see that Dollar will accelerate this topping process in stocks, as explained in Dollar Ready To Create Havoc With Markets.
Note that purple box on this chart is where we will be aggressively buying stocks again, and playing our short term trades from the long side (after we opened a short position on Thursday).


