It was a pretty intense shock that hit the stock market on Thursday September 3d, as well as the day after in the morning. Is another Black Thursday underway, a market crash 2.0? Or is this an ordinary retracement?
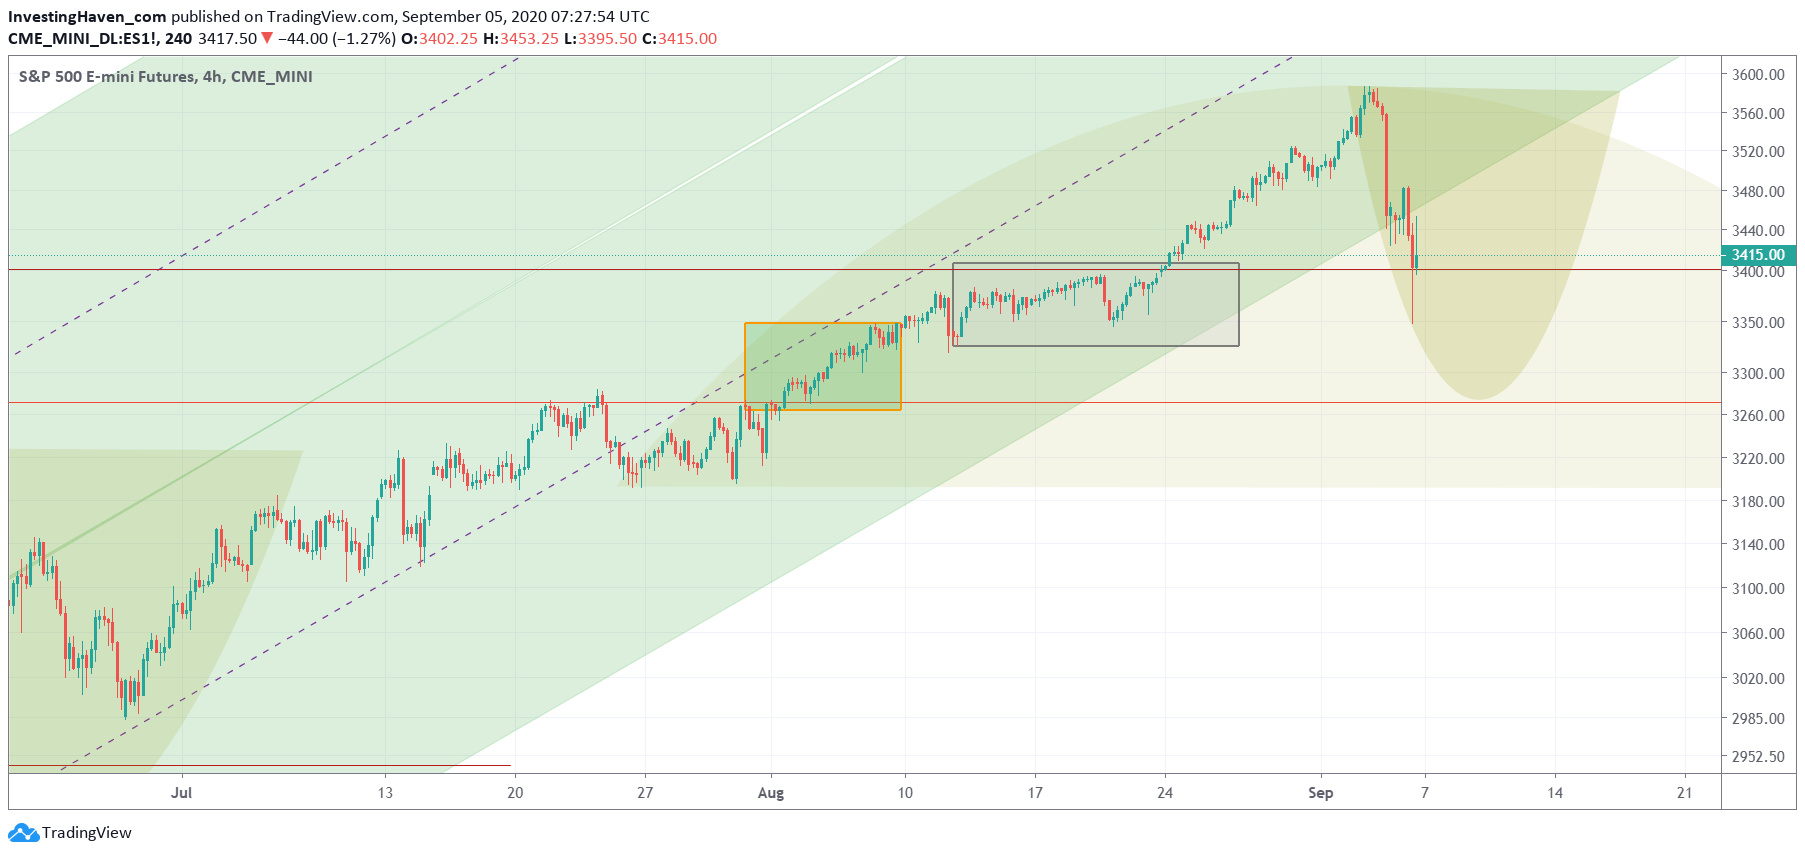
Our S&P 500 chart, with our own annotations, can help us understand what’s going on.
First of all, so far, the sudden decline qualifies as a backtest of the all time highs breakout. So far, successful, but we need more trading days to validate this.
Second, the sudden and violent decline created a short lived reversal setup. That’s the darker yellow pattern on below chart. Provided this pattern is dominant, we can reasonably expect volatility until the third week of September, another 10 to 12 trading days. Some relief rally combined with another sudden sell off is the most likely path forward.
Third point, however, is the potentially longer term bearish topping pattern, indicated with the lighter yellow pattern on below chart. This is the not-so-rosy outcome.
We cannot know for sure, based on this chart, whether the long term topping scenario will play out … but if we combine our intermarket analysis skills with below chart we would say that’s a very unlikely outcome. Why? Because of this: Must See Chart: The Mother Of All Tops combined with Meet The Breakout Of The Year: Interest Rates
Fourth, the rising trend in the S&P 500 may simply be slowing down. A move from a higher to a lower band in the rising channel is nothing unusual. It is an ok-thing provided the darker yellow pattern is the dominant one.


