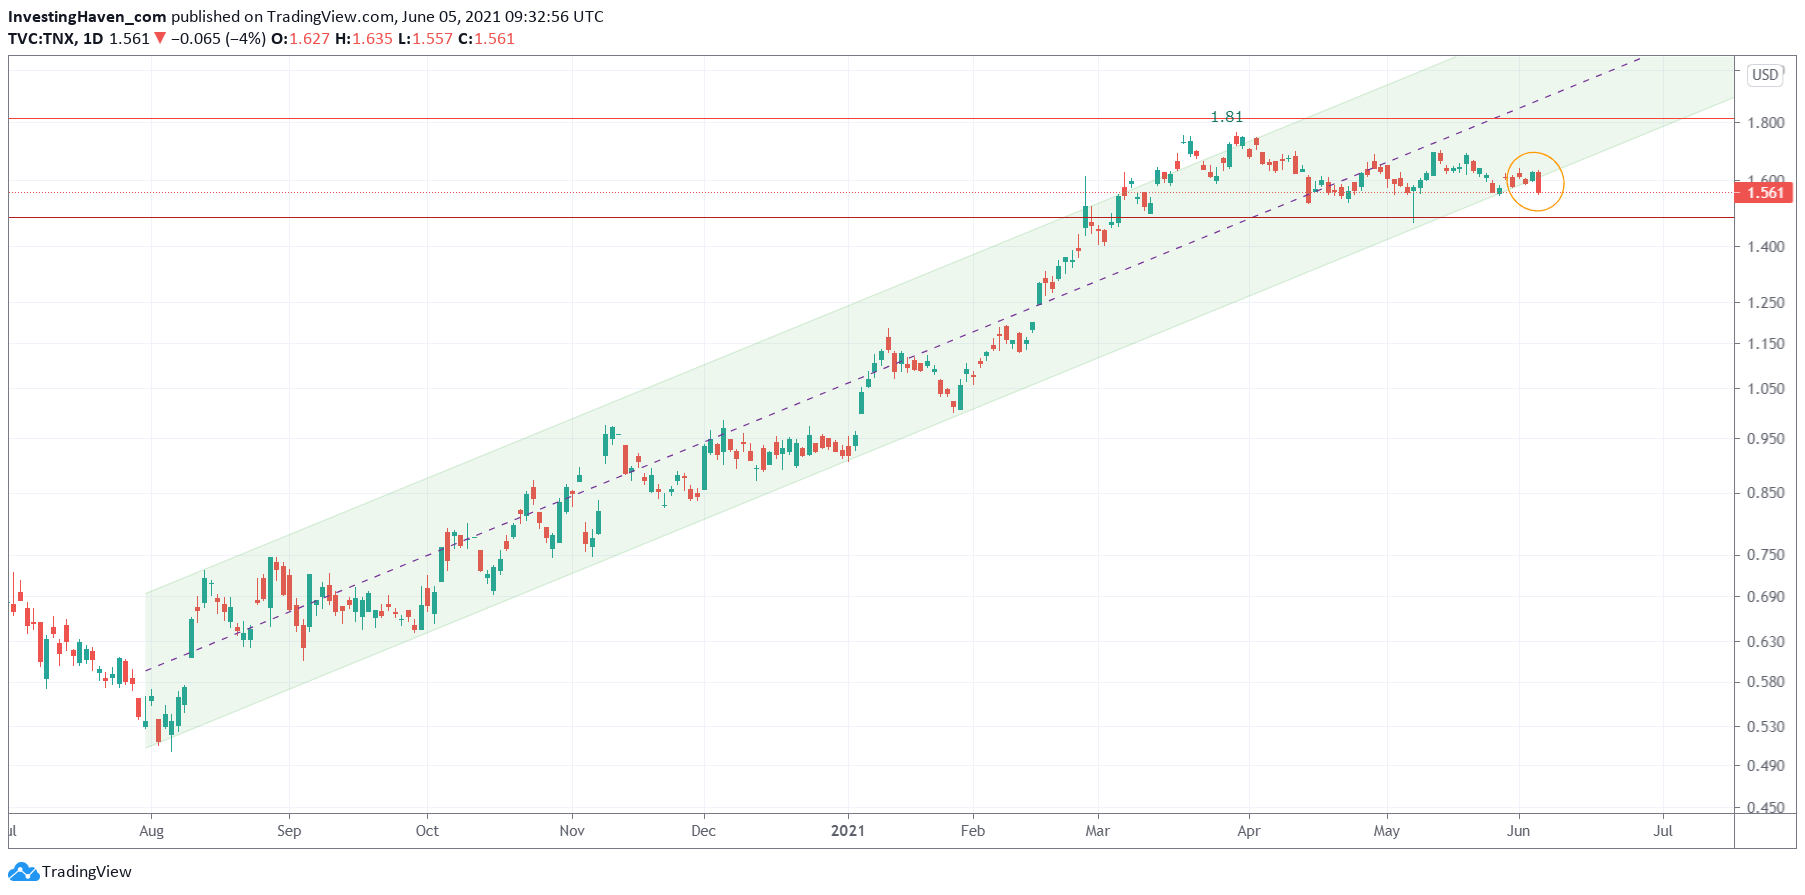
Our stock market forecasting methodology has one cornerstone: analyzing intermarket capital flows to find trends across markets. You then need to complement this with advanced charting and price point analysis to be properly positioned, and be profitable most of the time. One such intermarket correlation is between stocks and the bond market. We use bond yields, TNX (10 year yields) to simplify things. TNX has a message for stock market investors: better be careful here, be ultra selective in what you hold and be ready to add to the lower sides. We forecast some weakness in stocks in the next 4 to 12 weeks which should be considered a buy opportunity because 2021 is a bullish year for stocks.
The 10 year bond yield chart had a very powerful uptrend since August of last year.
To be more precise that’s August 6th, 2021 when it all started. It was the day when the price of gold peaked. Surprising? Coincidence? Not at all, we call it intermarket dynamics and it reflects the way financial markets function.
So bond yields went up for 10 straight months, from August 6th, 2020 till June 3d, 2021. The fact that this instrument now is losing support of its rising channel must mean something. What does it mean?
- If bond yields fall, it means that the price of Treasuries rise.
- If the price of Treasuries rise, it means that investors have a preference for Treasuries (capital is flowing into that sector).
- In order to move a market like Treasuries you need a huge amount of capital. It has to come from somewhere. It has to come from offensive or risk-on sectors, first and foremost stocks.
- As capital moves out of stocks it is flowing into Treasuries and created a Treasuries uptrend / stocks downtrend.
So when you see a chart like the one below the first thing you have to do as an investor is look for the stock market sectors that are weakening at this very point in time. They will be hit hardest.
At the same time you have to look for sectors that are improving, and are getting a bid around the same time.
Is there any sector that is getting a bid now? Maybe, just maybe, precious metals are negatively correlated with bond yields. Maybe, just maybe, bond yields started their 10 month rise exactly the same day gold and silver peaked (August 6th, 2020). Maybe, just maybe silver is successfully testing a breakout level the day bond yields are breaking down, on June 4th, 2021.


