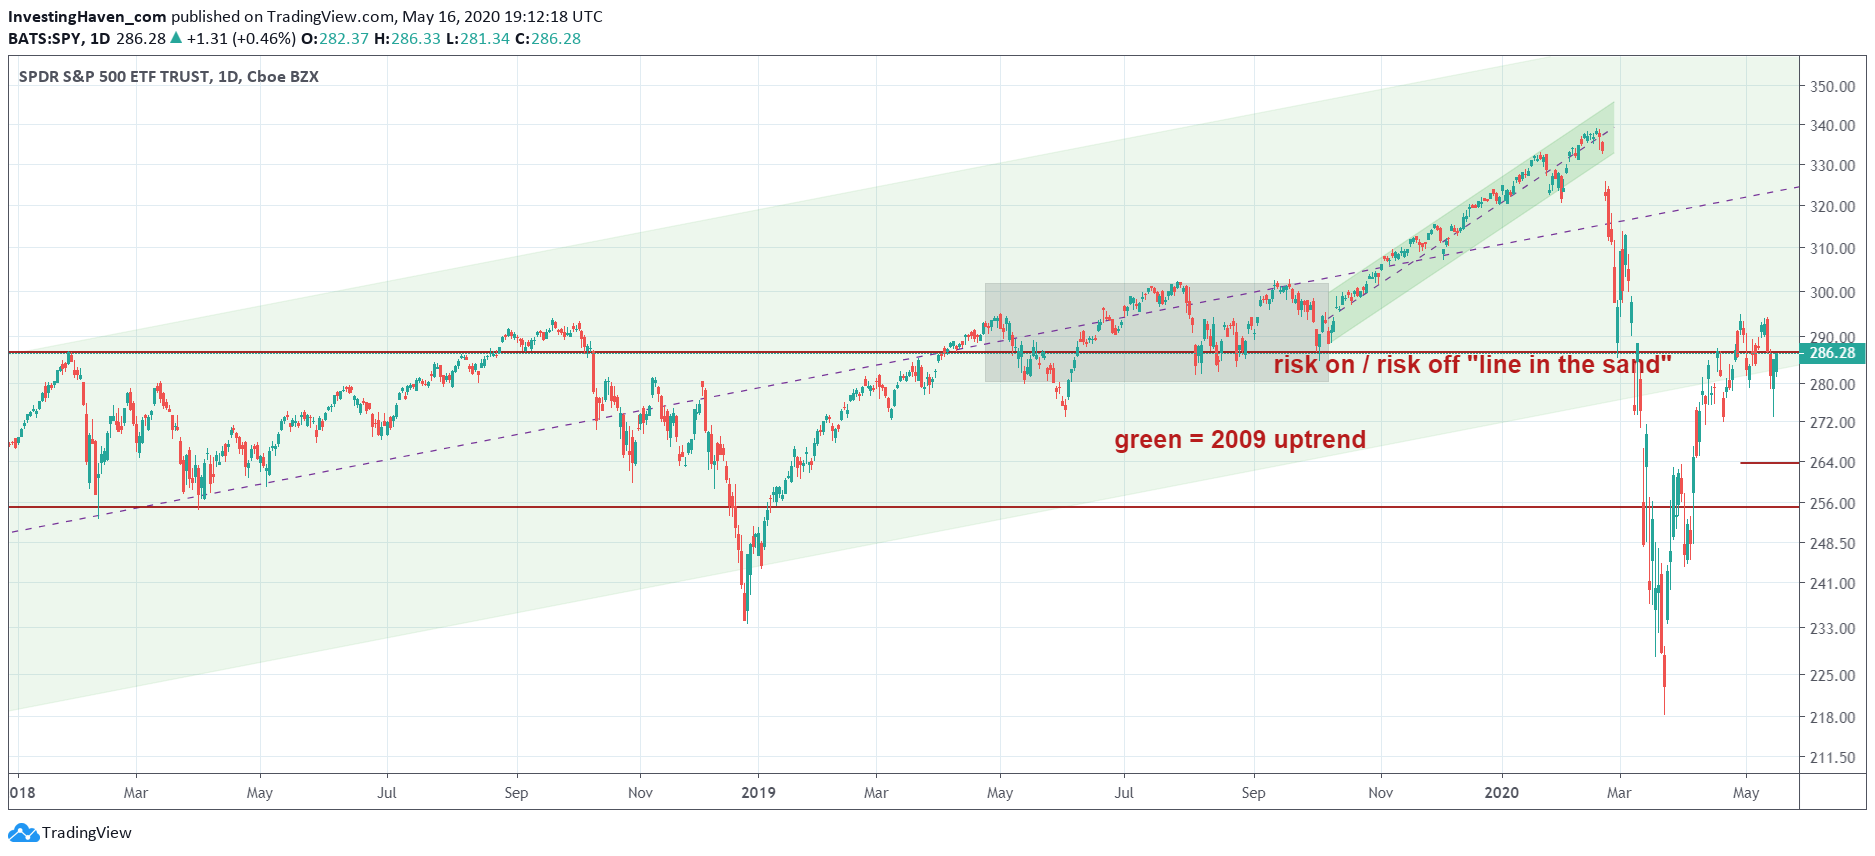
Stocks were flat in the last 2 weeks. At least, stock indexes were flat … some individual names performed well but that’s not the majority of stocks out there. Why is there hesitation in stocks, and what comes next? Do we still believe our bullish Dow Jones Forecast is underway?
We’ll try to answer both questions with one and the same chart.
First of all, we don’t go into ‘event analysis’. Many of our followers tend to ask questions related to Corona pandemic, bad economic data, unemployment statistics, etc. All that is either economic in nature, or fundamental … or related to ‘events’.
We don’t do fundamental analysis nor ‘event analysis’. It’s pointless to understand market direction, and even more pointless to make capital grow with short term trades. It’s only confusing.
We look at intermarket capital flows for longer term positions, and price point analysis for short term trades.
The reason why there is hesitation in stocks in the last 2 weeks is because the S&P 500 reached a pivotal price level that goes back 11 years in time. We are testing the 2009 bull market channel, as seen on below chart (green).
Moreover, this exact same price level has proven to be the ‘line in the sand’ for risk off vs risk on cycles over the last 2 years (horizontal red line).
It’s that simple, forget about Corona / unemployment / US Fed / etc.
Long term we believe SPY will overcome this level particularly because our crash indicators suggest that tensions are easing. It doesn’t tell anything about the short to medium term, it tells something about the direction 18 months out.
In the short term we see a big move coming in this market.


