We identified 3 top tech stocks for 2019 in the small to mid cap tech sector. However, before taking positions, it is instrumental to align on the overall dominant market trend. The level of strength in broad markets combined with the level of strength in the technology sector should determine the positions in tech stocks. This article shows a simple indicator to know if tech stock should be an aggressive buy or sell in 2019.
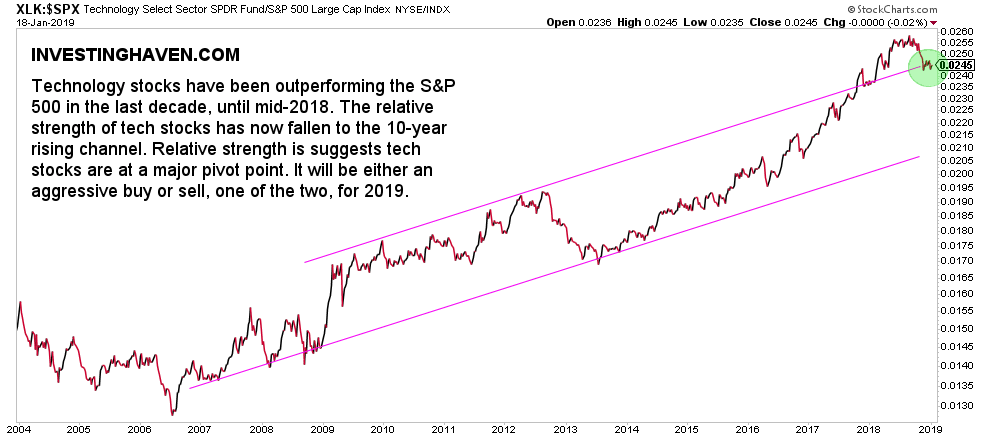
The indicator we apply to understand if the technology sector is an aggressive buy or sell in 2019 is the relative strength against the S&P 500. Sounds simple, but the long term relative strength chart reveals an important insight!
The relevant technology sector index is the XLK index, and the timeframe we apply is the monthly because we absolutely need insights into the dominant trends. The relative strength long term chart is embedded in this article.
There are a couple of very important insights that we get out of this relative strength technology sector chart:
- Technology stocks have been outperforming the S&P 500 in the last decade, until mid-2018.
- The relative strength of tech stocks has now fallen to the 10-year rising channel.
- Relative strength suggests that technology stocks are at a major pivot point.
In other words that happens at current levels will be instrumental for investors that seek exposure to the tech sector. We are at a pivotal point. Either the uptrend continues or relative strength in this sector is lost which is a big thing after a decade-long outperformance.
What we conclude is simple and clear: in case the XLK to SPX ratio continues to trade in the upper area of its 10-year rising channel will we justify an aggressive buy on tech stocks in 2019. If not it will be either a sell or a neutral position that is justified.


