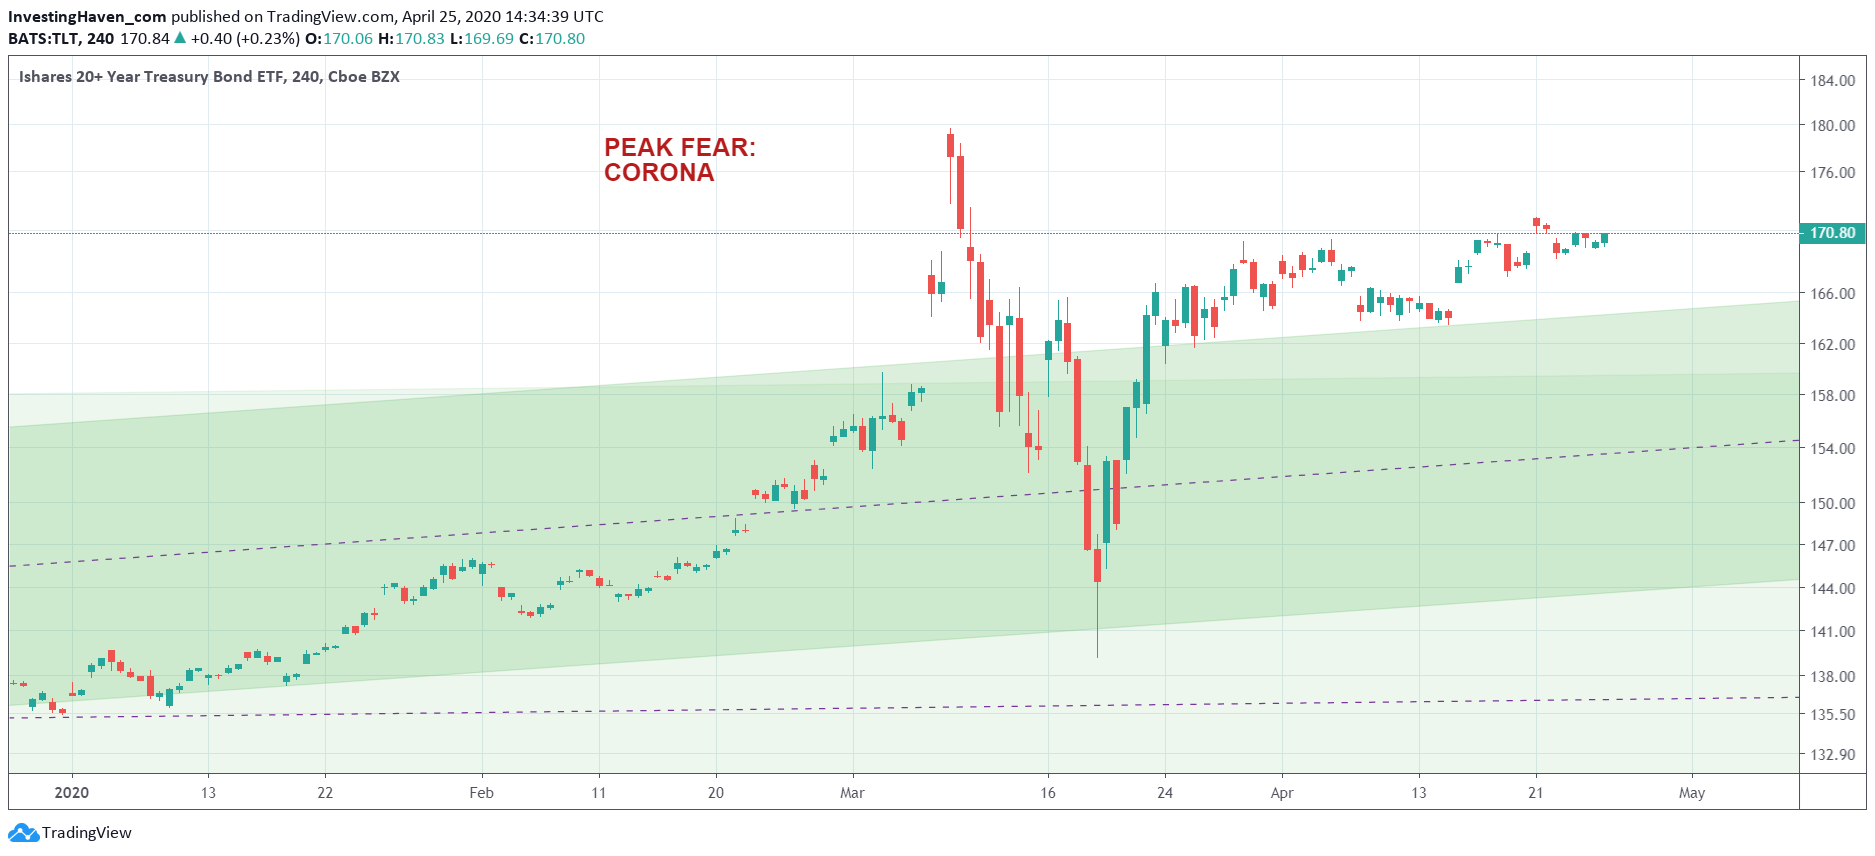
It was just 6 weeks ago that the world was shocked by Black Thursday and Black Monday (the 2020 edition), a sequence of 2 cataclysmic crashes within 3 trading days. Never seen before, it was outrageous and aggressive like a once in a century type of tsunami. Our fear indicator (TLT) exploded to all-time highs. If anything this indicator continues to look very concerning: it does not have the intention to ease. Can markets rise as long as our fear indicator continues to signal ‘peak fear’?
We are in uncharted waters.
This implies we have to be open minded for any outcome. At the same time we have to respect each and every trend, no matter how concerning it looks.
That’s a fine line.
Take our fear indicator: it now trades above of its 20 year trend (green area seen on below chart). Moreover, and that’s our concern, it looks set to move higher.
Indeed, this is conflicting with another indicator which we mentioned today: A Hopeful Sign In This Leading Stock Market Indicator
Go figure, and good luck reading markets in current conditions. It requires a lot of continuous analysis to identify trends nowadays.
Can this fear indicator continue to rise without creating havoc? Only once in history before did this indicator trade above 170 points, and that was a few days before Black Thursday and Black Monday. In other words this indicator did induce those cataclysmic crashes.
Will this happen again?
We cannot exclude it, but don’t think it will get that worse again. However, this indicator clearly signals that we have to be very careful with our trades.
We take our fear indicator really seriously. It helps us inform which trades are justified, which not, especially in our Momentum Investing portfolio. Join our work to track how we take trades, and why we take them, especially in fearful markets like the ones we are going through currently.


