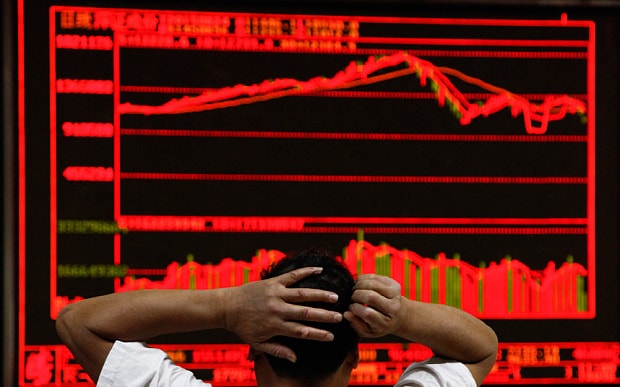
The market continues to be a big mess. It started a year ago, approximately, and did not really improve with the exception of the October bullish momentum trend that lasted exactly 3 weeks. What’s surprising, and also challenging, is that indexes still continue to hide the big damage that is happening ‘under the hood’. That’s why it feels like a stock market crash, it certainly is a crash for many stocks and markets, but indexes can still hide it pretty well.
Last week was horrible, for sure. With 4 consecutive days of selling in a short trading week it goes without saying that good damage was created.
The driver of selling, last week, was technology. Not only, but primarily.
No coincidence, in the category of ugliest charts we can primarily find tech stocks.
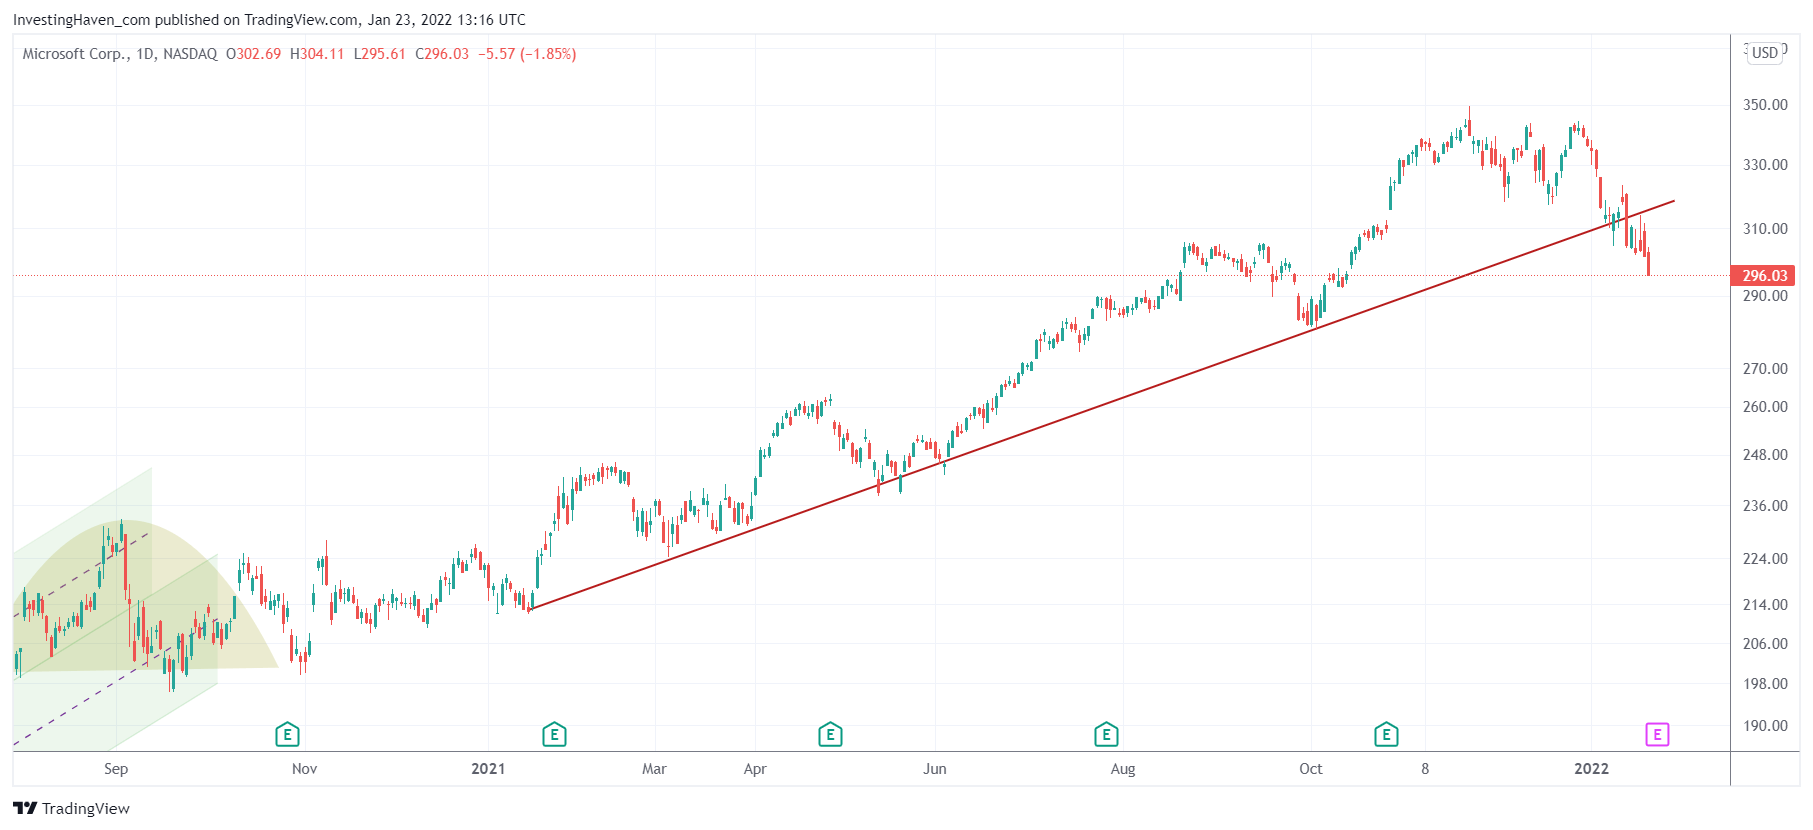
Microsoft, although not dramatic in terms of decline, lost its 2021 trendline. After 12 full months in a nice uptrend it is now, since Thursday, below the trendline.
A consolidation might start, the only question is at which level. First support comes in 280 points but below that level it will be 240 points. Not a great outlook. Although it won’t go in one straight line down we can reasonably expect the 240 level to be hit in the next month or two, unless a really solid consolidation starts around 280.

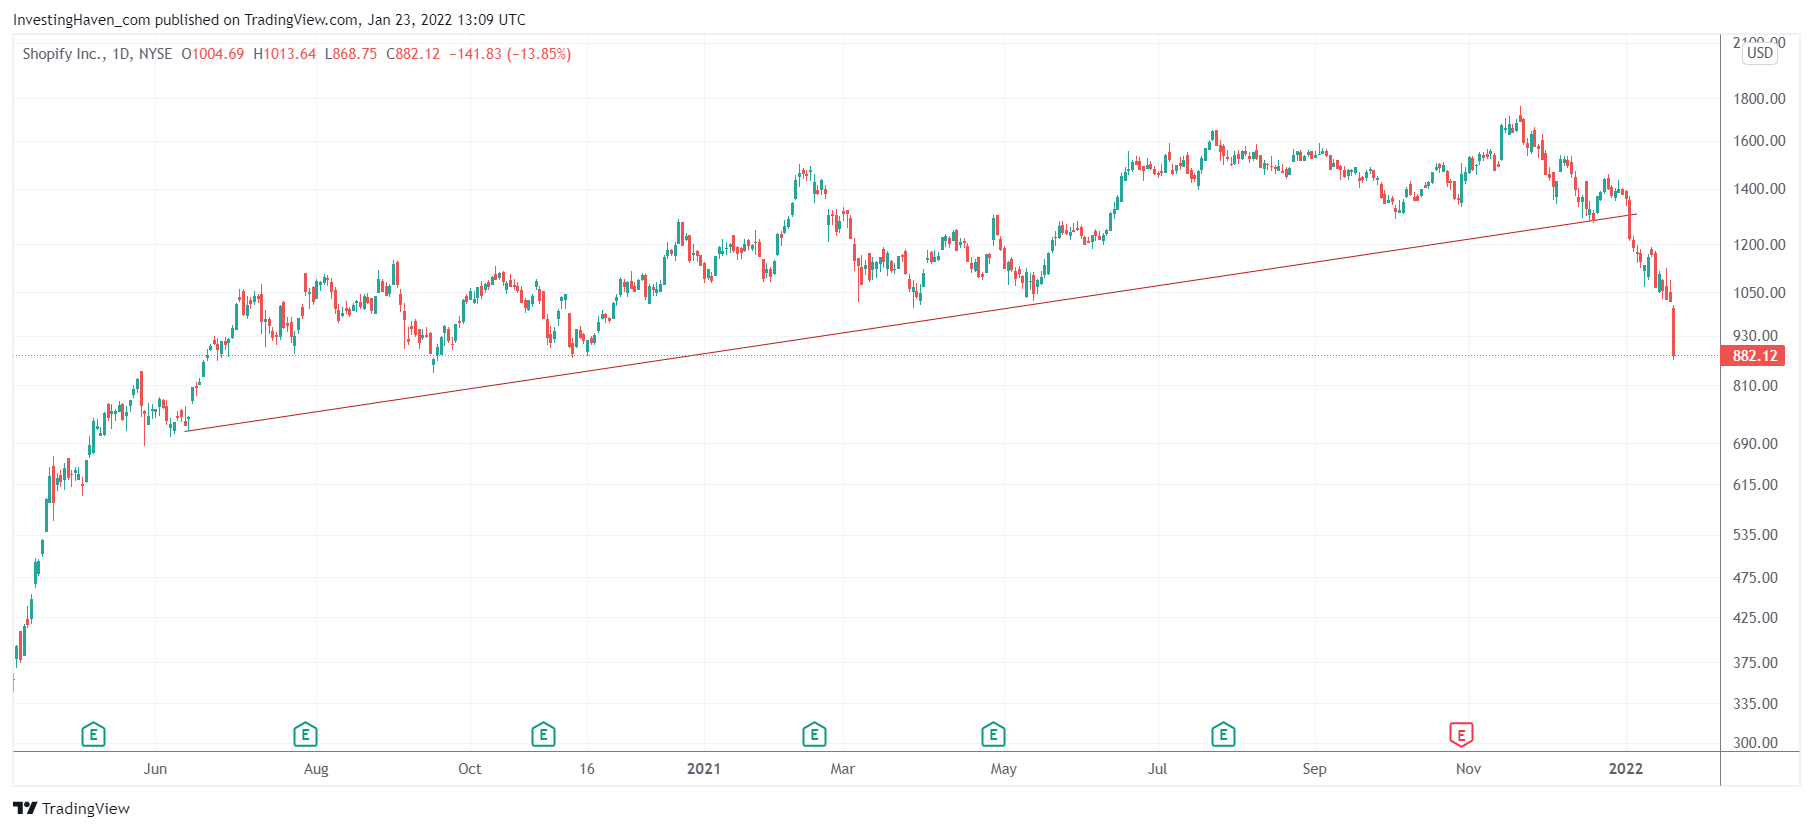
Shopify, one of the top hot stocks of 2020 and to some extent 2021, broke down early January. The damage on Friday is significant. The bearish target is presumably 700.

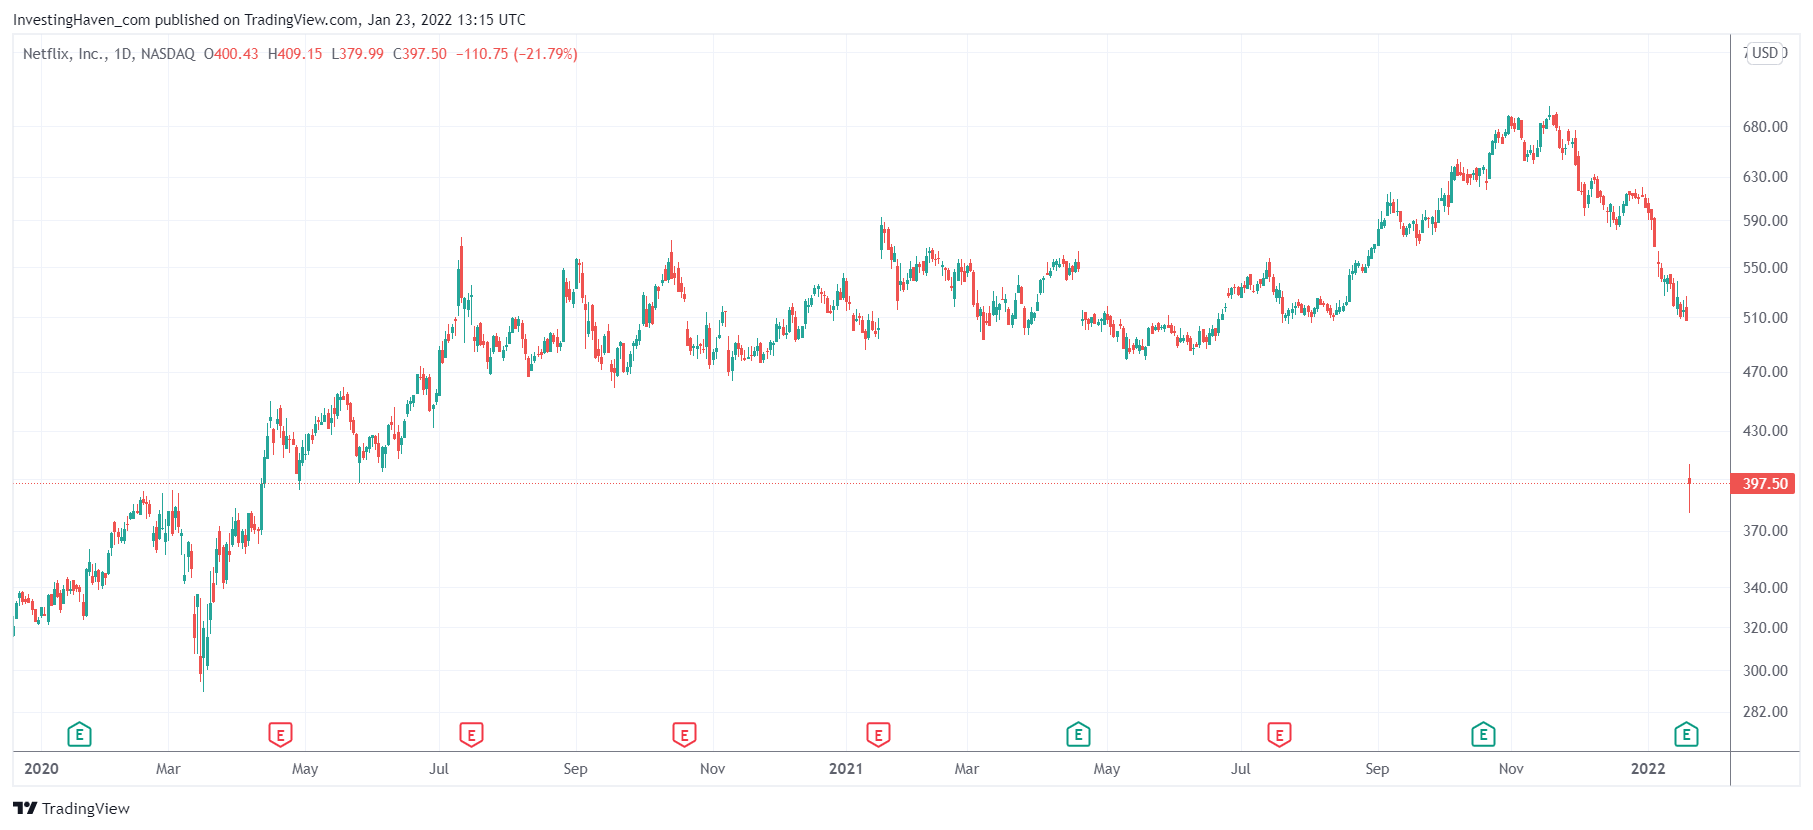
The worst performer of the month and ugliest chart of the month is without any doubt Netflix. Earnings were somehow in line, on Thursday, but the market decide to send this stock 21% lower. What an ugly chart. Who knows, maybe this qualifies as an epic buy opportunity for the long term. It might be, we won’t bet on it yet. We prefer not to catch falling knifes but give time before a more constructive setup starts developing.


