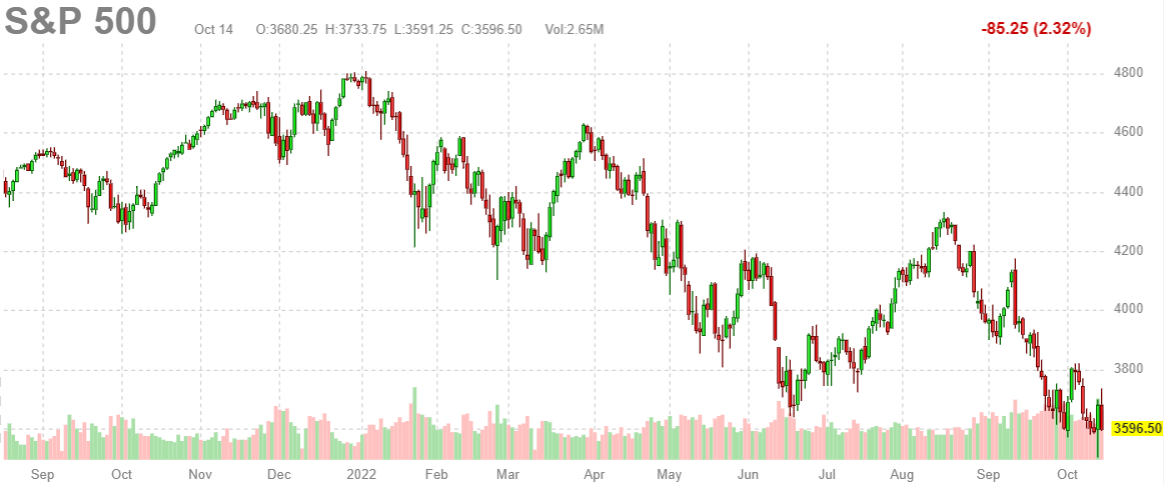
On Thursday, Oct 13th, early in the session, we wrote this timely update: The Market Will Not Move 50% Lower Contrary To What The Gurus Are Telling You. There may be a lot of anxiety and uncertainty in the market, but this fear mongering forecast of a 50% decline seems not reasonable, is our viewpoint. Is the market able to start a countertrend rally, after it selling pressure hit the market on Friday? Here is a tip from our premium services on how to know whether the market is bottoming.
We look at the S&P 500 chart and can share this one tip that we also shared a few weeks ago in our premium services. Investors need to watch price action a 5 day trading basis and see one of the following 2 scenarios unfold for a high confidence bottom setup:
- Three large wicks (intraday reversals) near 3666 in 5 days. We got one on Friday, we require two more by Thursday.
- Two large wicks (intraday reversals) near 3666 and one really large green candle in 5 days, the first wick was printed on Friday.
The market is going down for nearly 2 full months now. A local top was set mid-August, a 6 week decline followed until Sept 30th. In the last 2 trading weeks, the market essentially went nowhere. It might be working on a bottom formation though.
It might be time for at least a countertrend rally, best case a lasting bottom.
If the market will follow one of the two scenarios mentioned above we will know whether a bottom will be set. If we turn to the daily SPX chart, shown below, we can see that the market printed one huge ‘wick’ on Thu Oct 13th. What we need, the latest by Wednesday Oct 19th, is one large green candle and one more such ‘wick’. Alternatively, two large wicks by Wednesday is going to work as a bottom confirmation as well.


