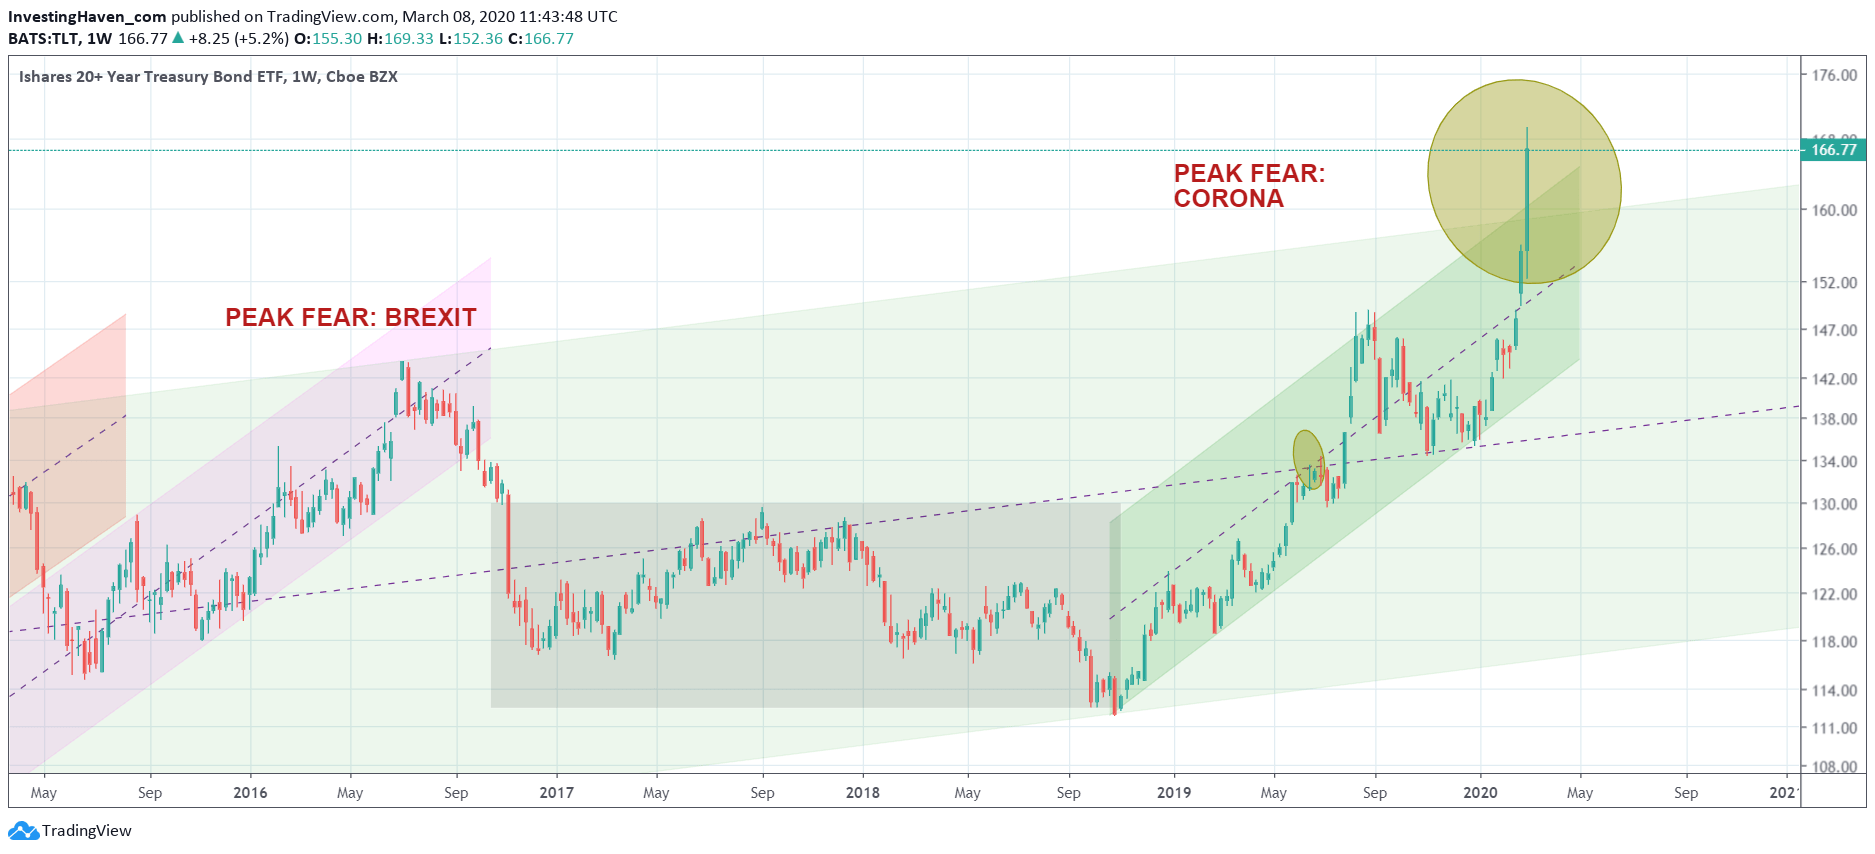
One week ago we said that Peak Fear Is Here. Since then the peak became even more extreme. The Treasuries chart which we use as the barometer for fear is now off the charts. It was an easy call to forecast 160 points in TLT, but the spike to almost 170 points on Friday is absolutely ‘off the charts’.
The corona fear is hitting extremes.
Whether this is ‘justified’ or not is beyond the scope of our work. We can only look at the impact on markets, and ensure we are positioned correctly.
In recent weeks we went into cash in our medium term portfolio, hit a few big hits in our short term trade portfolio in the S&P 500 category and were break even in our emerging markets category. Overall much better than indexes, but we want more and better of course.
That said, the one feature that stands out right now is the once-in-a-decade crash of interest rates. 10 year rates, our leading indicator, literally fell through every possible support level. It is ‘off the charts’.
Consequently Treasuries (TLT) are going ‘through the roof’ now, and the TLT chart embedded below visualizes this nicely.
The ‘corona effect’ is not a systemic, but an epidemic effect. That’s how it is playing out in markets right now. Very sudden declines, extremely sharp and aggressive. Consequently we can expect the opposite to happen as a reversal. The million dollar question is ‘when’?
There is no way to justify standing in front of a selling avalanche. We believe markets are at crossroads right now: stabilization of +10% additional selling. And as things move fast right now we can expect IF (it’s a big IF) additional selling takes place it would go very fast.
Timing is everything, especially in conditions like the ones we currently see.


