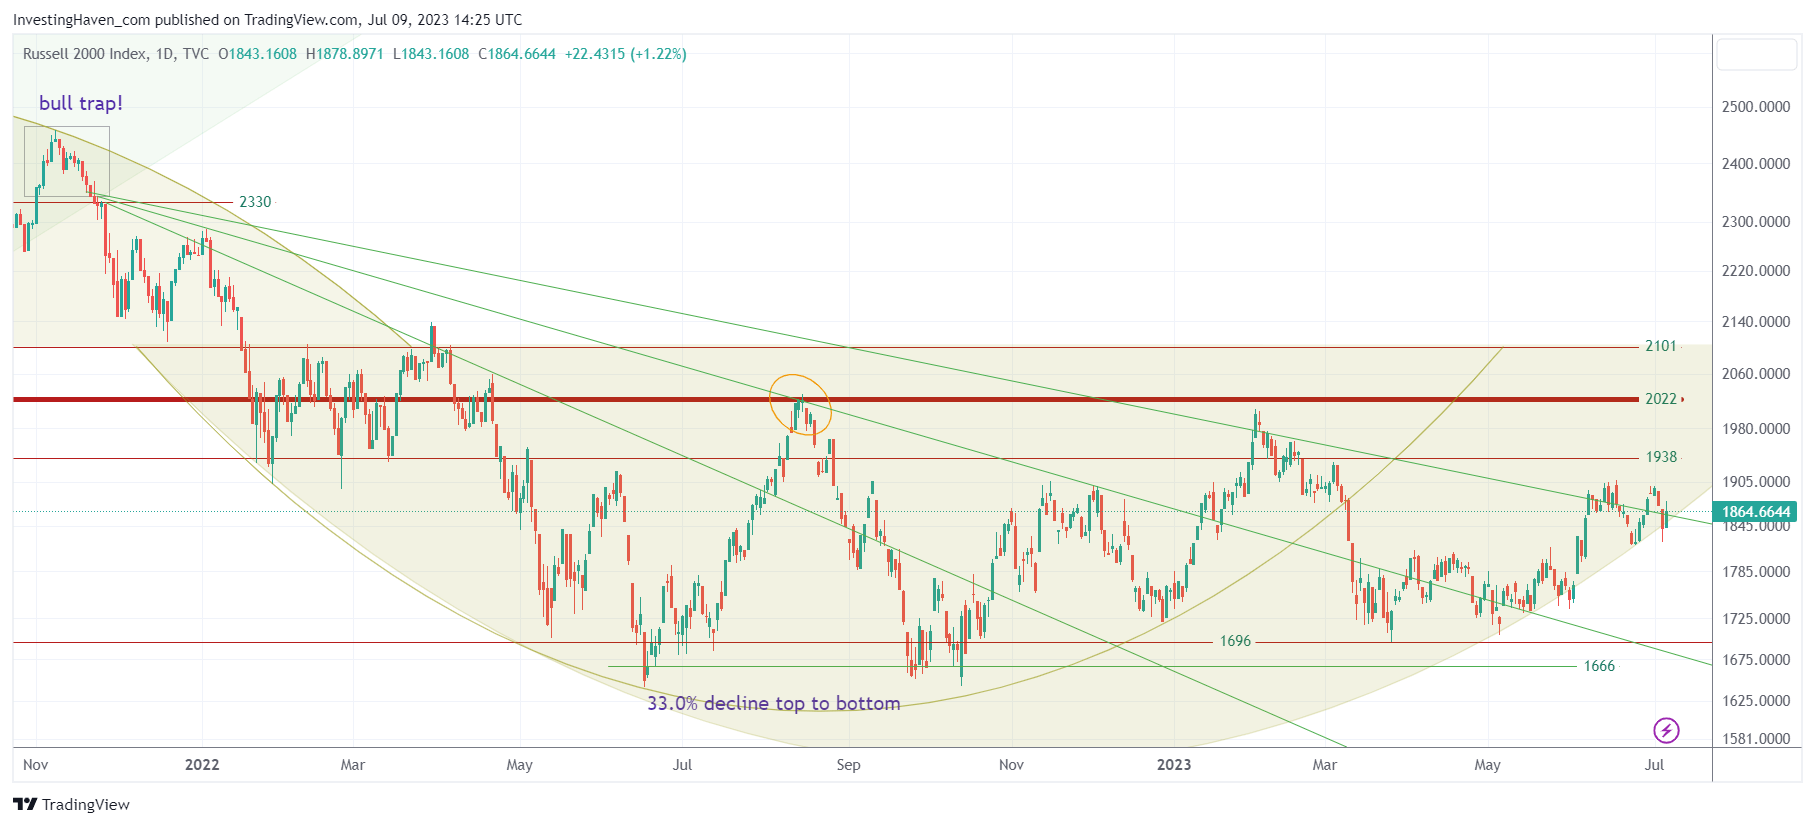
One of the leading indicators in our methodology, to forecast the direction of the broad market, is the Russell 2000 chart. We analyze this chart to understand its pattern, we want to understand its pattern as a signal for broad market momentum. While we were concerned in May with the Russell 2000 chart structure violation, which was ‘fixed’ up until two weeks ago, the setup in leading indicator Russell 2000 is now about to change.
We explained how and why we look at the Russell 2000 chart in this article This Leading Indicator Loses Bullish Structure, Now Very Vulnerable:
Analyzing the Russell 2000 chart is of utmost importance for investors and chartists, as it serves as a valuable momentum indicator and a leading signal for the broader stock market. This index provides insights into whether momentum is accelerating (bullish) or decelerating (bearish), guiding investors on potential opportunities or risks. The significance of studying the Russell 2000 chart lies in its ability to signal turning points and trend reversals, offering valuable clues for market participants.
One week ago, we finally got early signs of a constructive setup when we wrote This Leading Indicator Has A Summer Message For Stock Market Investors:
In conclusion, the chart analysis of small cap stocks, as represented by the Russell 2000 index, suggests a promising summer ahead. The bullish long-term reversal pattern, along with the constructive setup and positive market sentiment, indicate potential opportunities for investors. However, it is important to navigate the market’s sector rotation carefully and identify the sectors that will move in sync with small cap stocks.
In the meantime, the Russell 2000 continues its attempt to improve. What stands out is the relative strength on Friday, July 7th, when leading indexes closed lower while the Russell 2000 was up more than 1%. This is a data point that matters, especially when combined with the rounded chart structure that is being respected since the violation in May.
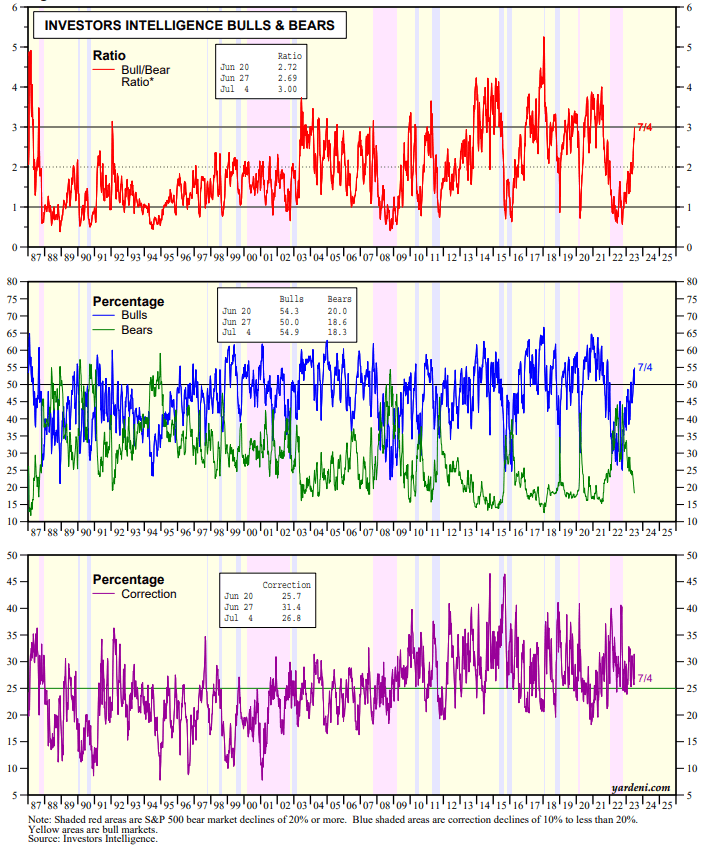
The Bull/Bear Ratio (BBR) compiled by Investors Intelligence jumped to 3.00 during the July 4 week. It is the highest reading since the bull run from March 23, 2020 through January 3, 2022. The bull then got gored during the bear market through October 12, 2022. During the latest week, the bullish percentage rose to 54.9%, while the bearish percentage fell to 18.3%. We have found that from a contrarian perspective BBRs at 3.00 or higher are not as bearish as readings of 1.00 or lower are bullish. Nevertheless, high bullish sentiment can be a caution flag. After all the S&P 500 is up 24.6% since October 24th, 2022.
This is the chart that comes with his commentary (in quotes, above):
What does all this mean? According to us, the way we read leading indicators, sentiment, combined with our proprietary cycle analysis:
- Rotation is the name of the game. Rotation will continue this summer.
- Sentiment might be too bullish, it’s not sustainable. However, what we do know is that the MegaCap8 has been leading a few indexes higher, notably the S&P 500 and the Nasdaq.
- Given the chart setup in the Russell 2000, we would not be surprised that a few specific sectors and stocks will experience a hot summer.
Sentiment might remain bullish, confirming that the inevitable pullback will hit, but it might happen late this summer. In the meantime, rotation will remain the dominant market force.
In the same spirit, we do expect a hot summer for silver investors as mentioned in When oh When Is Silver Going Start Its Bull Run and Junior Silver Miners: Bargains At Multi-Decade Support. We also expect a few AI & Robotics stocks to perform well, as explained in great detail in our AI & Robotics Top Stocks For Long Term Portfolios. As evidenced by bullish price action in Rivian, last week, we also believe that NOW is the time to initiate positions in EV, lithium & graphite stocks.


