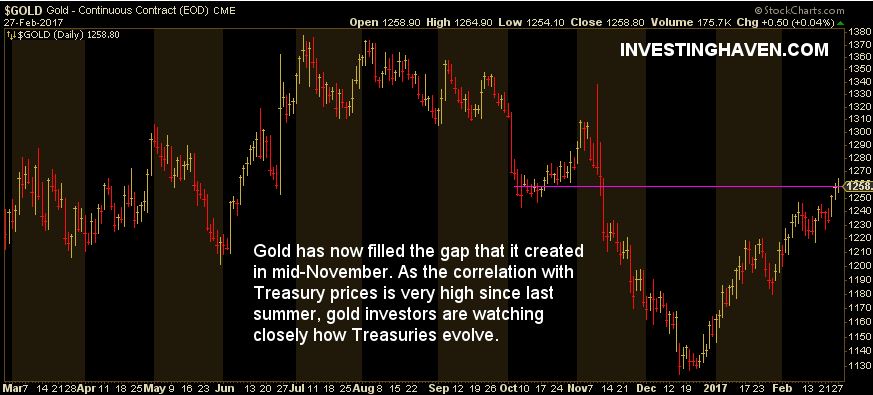
As March 2017 kicks off gold investors get excited after a +10 percent rally in the price of gold since end of last year. That brings the price of gold to the important $1250 level.
So far our gold price 2017 forecast is not met though we believe that the probability is still very high that gold is on a path lower. As always, this has to be confirmed by price action, we never stick in a dogmatic way to forecasts.
MarketWatch notes that gold price demand in March 2017 is lifted by “growing concerns about geopolitics, while the Federal Reserve’s lack of commitment to lift benchmark interest rates also helped to support higher prices in the precious metals.”
We believe that is a great point by MarketWatch, although, potentially, not made consciously. The point is that there is a strong market correlation since last summer between the price of gold and Treasury Yields. Let’s zoom in on that with the two charts in this article.
First, the daily gold price chart shows how gold has almost filled the gap which it created last November. Investors still see a defensive market here, as filling a gap down is primarily bearish.
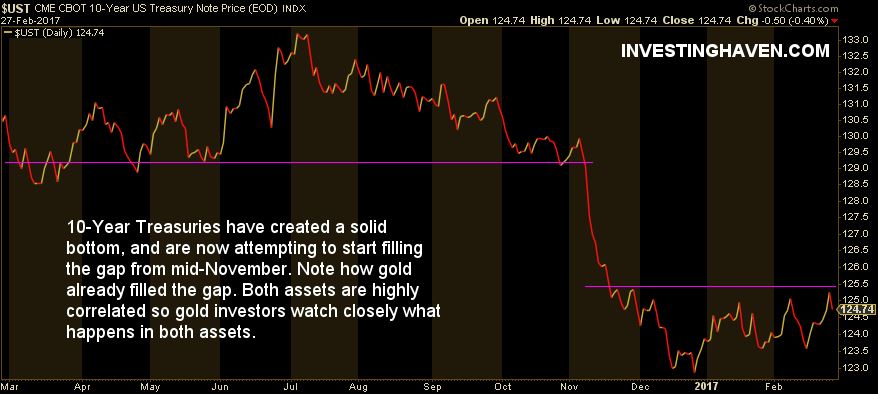
Yields are consolidating lately. Treasury Notes show an almost similar trend as gold prices which is visible on their charts. That is exactly what InvestingHaven means with the primary market trend: market correlations exist during a certain period of time and one market leads the trends in other markets.
So far, Treasury Notes have consolidated below the gap down. That is different from gold which already filled the gap down.
What that tells us is that March 2017 will be an important month for both gold and Treasuries. Moreover, the prices of both markets are at very important levels. Watch closely what gold does at $1250 to $1260, as well as 10-Year Treasury Notes at $125 to $129. It will carry predictive value for the coming months.


