Successful investors not only catch rising markets or stocks, they also avoid the ones that are falling. In other words, success is not only making profits, but also avoiding losses. One such case is the semiconductor stock AAOI which could look compelling to buy as the whole semi space is rising but that may turn out to be an illusion, this is why.
Applied Optoelectronics, Incorporated (Nasdaq, AAOI) is a leading provider of fiber‑optic networking products that serves three growing end-markets: Cable Television Broadband (CATV), fiber-to-the-home (FTTH), and internet data centers (Data Center). The company designs and manufactures a range of optical communications products employing vertical integration strategy from laser chips, components, subassemblies and modules to complete turn-key equipment. Its proprietary – Molecular Beam Epitaxy (MBE) fabrication process has proven to be reliable over time and highly tolerant of changes in temperature and humidity (delivering millions of hours service), making them well-suited to the CATV and FTTH markets where networking equipment is often installed outdoors.
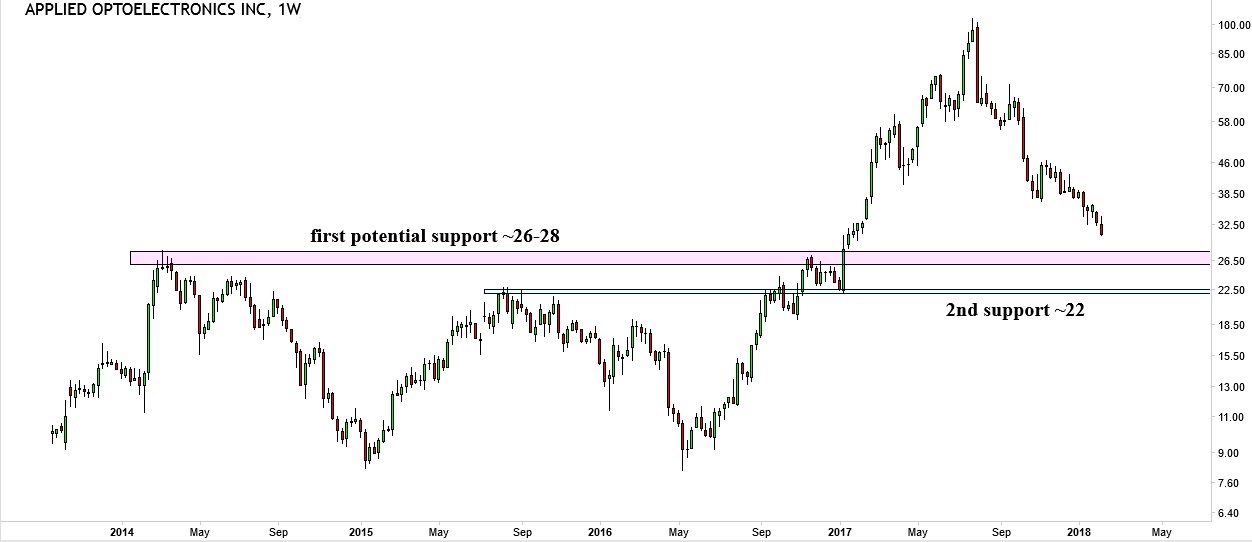
We saw that semiconductor sector had a wonderful year in 2017. However, the stock price of AAOI is a total failure. Since the third week of July, price of AAOI has fallen for a staggering 70% from the top of 103, and its price is stilling falling. This article is specially written in response to many requests from readers/investors focusing on fundamental analysis. They are puzzled to WHY or reason of continual falling price since many of them have been trying to catch the falling knife with no success.
Those who have been following our work since our inception have understood that InvestingHaven’s method does not rely on fundamental analysis of a company to find out whether its stock is worth investing in. We focus on chart analysis, more specifically charting to examine the entire structure of price movement and derive meaningful and actionable conclusions from it.
Weekly chart of AAOI
The weekly chart of AAOI above shows that after a price broke out of the “W” resistance of 28, the stock price had a stellar move to the top of 103. We project that the recent decline could come to a halt at the support level of ~26-28. We can’t guarantee whether it is good to investing even if price fell to this price zone as we need more candle patterns to confirm. Should this zone fail to provide support the next important support level will be around 22. The most hopeless scenario is if the price goes back to the price zone of 8.25 – 10 where the latter is the IPO price of AAOI back in 26 Sept 2013.
We feel really bad for those who bought or average along the way down based on fundamentals. It is a proven fact, over and over again, that fundamental analysis as the only base for investment decisions is NOT positively correlated to a trading or investing account. It is what it is, it may sound painful, and some may not be willing to accept this, but we are 100% convinced that our viewpoint is accurate. Again, we are talking fundamental analysis only as the basis for an investing method.
We want to summarize a few key take-aways based on this case.
- Investing is a risky business, do not risk more than you can lose.
- Never try to catch a falling knife simply based on the fact that a cheaper stock price can get even cheaper
- In case you have the shares while the price is falling, at least you can hedge by selling a call option to reduce the losses.
Above all, follow market movements and trends rather than trying to catch a falling knife.


