The world’s most famous smartphone is the iPhone produced by Apple Inc (Nasdaq: AAPL). Its first generation iPhone was a huge success when it was launched in 29 June 2007 under leadership of visionary Steve Jobs. The last stock split of 7-to-1 was carried out in June 2014 when price was $645.57. Since then price of Apple has doubled again to ~180.
However, something is odd when InvestingHaven’s team checked the monthly chart of Apple Inc. And it seems to be consistent with the fundamental reason of why Apple wants to cut down production by half as announced during its earnings report on 1st Feb 2018.
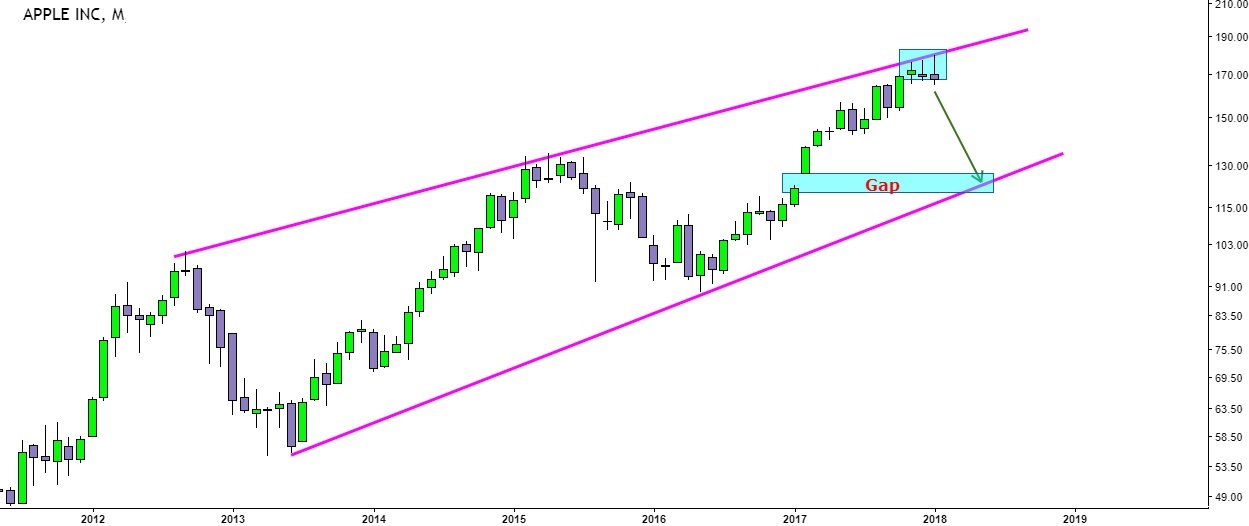
Monthly chart of Apple
The price of Apple has been forming a potential pennant since Sep 2012. And for the 3 months of Nov 17 to Jan 18, price has been stagnated and couldn’t break the 177-180 resistance area. There is a high probability that a correction is underway. There are 3 crucial levels of downside support, smart investors are watching them closely.
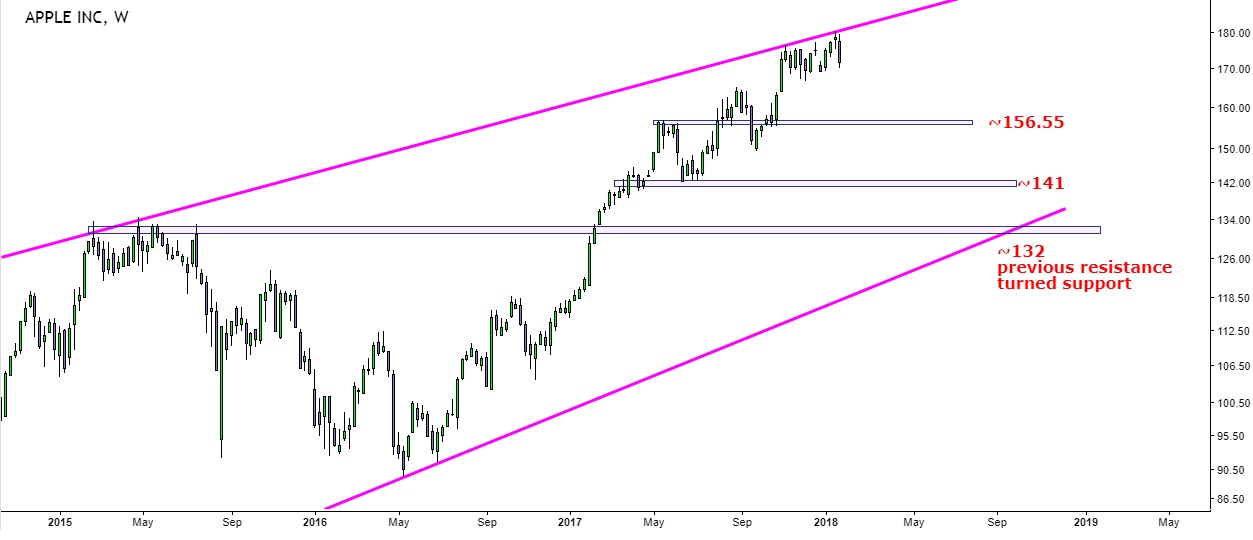
Weekly chart of apple
To have a better gauge of the potential support levels we zoom in into weekly chart.
The next immediate support is ~156.55, should this level fail which we highly suspect by the way then ~141 will be next potential support level. In between 141 < x < 156.55 we do expect lots of volatility.
Ultimately, the strongest, and, hence, most crucial support level, according to InvestingHaven’s team, is ~132. Uncoincidentally, this is the previous strong resistance point which, if respected, will result in resistance turning into support.


