The bitcoin price crash of 2017 is a fact. Bitcoin went from $2800 to $1800 in just one day. Is this the end of the cryptocurrency bull market or a buying opportunity?
Before looking into that question, readers should note that InvestingHaven wrote almost three months ago this bitcoin price forecast for 2017 where the upside target was $2000. That target was met, and, as it always should go, positions have to be reconsidered at such a point.
Bitcoin’s price crash – the bearish story
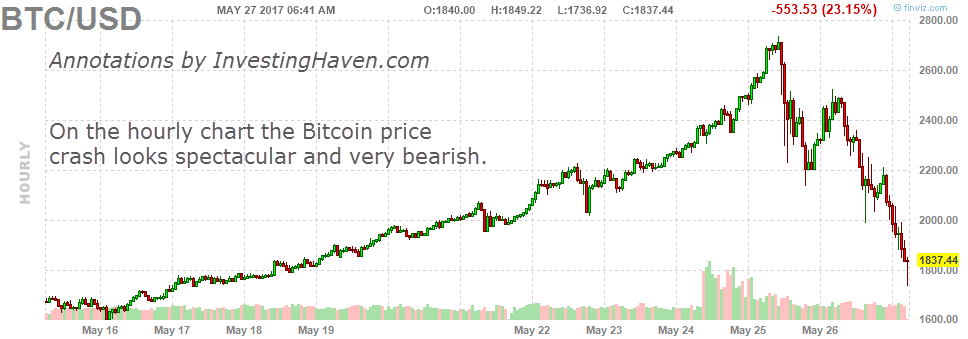
Let’s first start with the spectacular news based on the Bitcoin price chart: Bitcoin’s price crash visualized.
The hourly chart visualizes the collapse, and it looks indeed spectacular. This spurs very bearish feelings, and for people holding Bitcoin it probably is problematic.
The price drop from $2800 to $1800 in less than 48 hours is a 35 pct drop. This percentage really is a price crash in Bitcoin, in technical terms.
However, it is important to always zoom out, and look at the trends on the charts of higer degree timeframes.
Bitcoin’s price crash – the bullish story
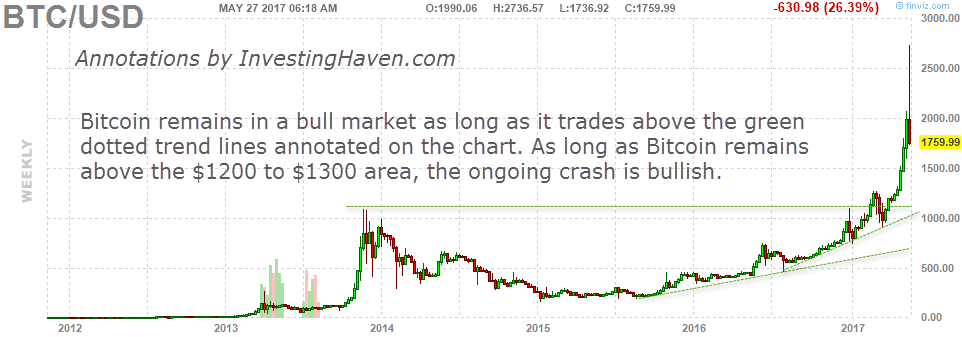
Once zoomed out, the crash in the price of Bitcoin looks totally different. Below is the weekly chart, and we added annotations on the chart to make our point. The green dotted lines are annotated by InvestingHaven’s research team. They indicate trends in Bitcoin’s price evolution.
The two rising trend lines suggest that Bitcoin’s price can come down to $1100 and even $700, and still remain in a long term bull market.
The horizontal trend line suggests that the 2013 peak of $1100 should be respected.
Combining all three trend lines make us conclude that Bitcoins remains bullish as long as it trades above the $1200 to $1300 area. As long as that is the case, the Bitcoin price crash of 2017 is bullish.
What that means in plain simple terms is that speculators are leaving the arena, and, hence, Bitcoins are rotating from weak hands (sellers) to strong hands (people and investors that hold them).


