Admittedly, uranium miners are a niche in the investment world. They should make up for a small portion in your portfolio. It is exceptional that we treat uranium on our blog. We spotted a very interesting, and bullish, sign on the chart of uranium miners, which we consider worth discussing.
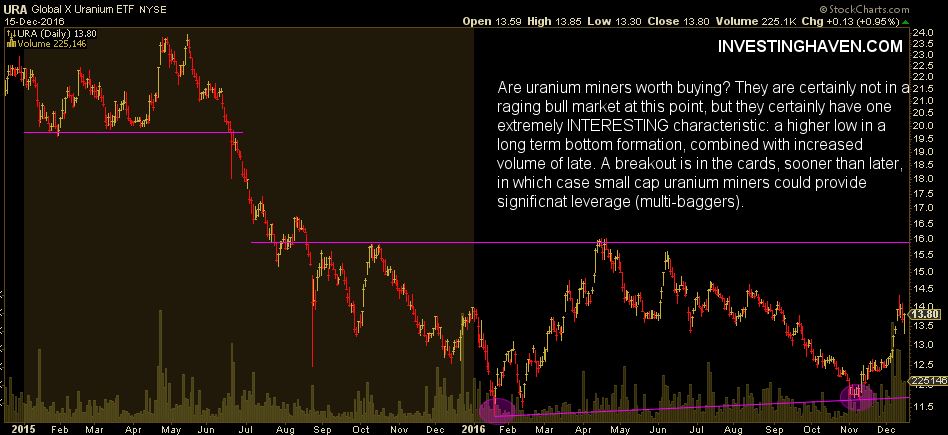
The uranium mining space is represented by the Global X Uranium ETF called URA. Last year June, URA broke down, and collapsed 50% in 3 months (top to bottom), as seen on the chart. Since then, uranium miners have been trading in a long term bottom formation.
Uranium miners – a bullish bottom formation
In November, something very interesting happened. URA made a double bottom, but, importantly, it was a higher low than the one in February. This may sound not too exciting, but we can say with a high degree of certainty that it could be a very bullish sign. It is a textbook example of a bottom formation.
Uranium miners will only be bullish once URA trades above 16 points, see the horizontal purple line on the chart. However, the bottom formation we just discussed, also annotated on the chart, could be a first bullish sign. It signals that selling power is fading. When no sellers are left … buyers take over control … which is what we see happening right now with increased volume after the recent low.
The uranium price continues to fall after it peaked in 2007. It is now back at its price level of June 2004. We believe that the slightest increase in uranium’s spot price will lead to dramatic upward pressure on uranium miners.
It is too early to become overly bullish, but this seems a good time to create a wishlist and set an entry point. Some small positions can be envisioned as well, for the longer term portfolio.


