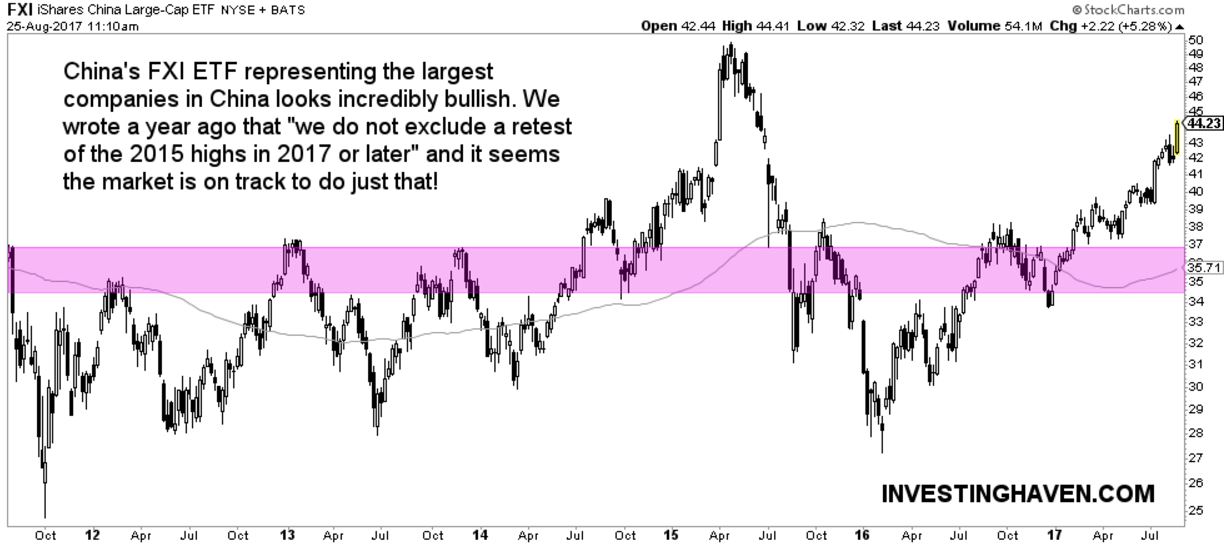
Large cap stocks in China have performed very well in 2017. As said many times before China was in our top 5 favorite stock markets in emerging markets. India was our top pick among emerging markets.
The strongest segment in China’s stock market are large cap stocks, represented by FXI ETF (FXI). The 5-year chart of FXI is shown below. Every investor vividly remembers the strong rally of China’s stock market in 2014 and 2015. Back then, it was driven by A-shares in China. Interestingly, this time it is large cap stocks as well as tech stocks that are stealing the show.
It is clear, based on this chart, that Chinese large cap stocks are well on their way to challenge their all-time highs, which basically is 50 points reached at the June 2015 top.
Currently, FXI trades at 44.23 points. An easy ride to 50 points seems almost given, although nothing is “given” in markets.
The million dollar question is whether FXI is on its way to blast through all time-highs and start an even stronger bull market than the one in 2014 / 2015. We do not know at this point, but the exceptionally strong performance of FXI suggests that this bull run has more legs.
Early this year, we wrote this piece with 7 Insights From China’s Long Term Stock Market Chart. This analysis based on China’s SSEC stock market chart is still very accurate and relevant, and we want to quote three important insights from that article:
- China has a strong reputation of moving in a very aggressive way once a bull market starts heating up. Expect fireworks somewhere in the coming years, similar to 2015.
- The longer the silent uptrend, the higher the upside potential, as the channel is moving higher.
- The dotted lines on the chart show why 3500 points in the SSEC index (SSEC) is in a way a breakout point, once above 3500 things are very bullish.
Note that the SSEC stock market index in China is less than 5 percent away from that important level of 3500 points. You see why we don’t exclude a serious rally in FXI?


