The energy stock market sector is losing momentum. The XLE ETF, representing the energy stock market sector, lost 2.30 percent today. The longer term chart show that a potentially bearish trend could start once the 69 to 71 area in XLE is broken to the downside.
As pointed out recently, crude oil is one of those 5 Leading Markets At Major Inflection Points currently.
InvestingHaven’s research team revises the energy stock market sector based on the XLE chart on 2 timeframes: the weekly chart on 5 years (long term) and 15 years (very long term).
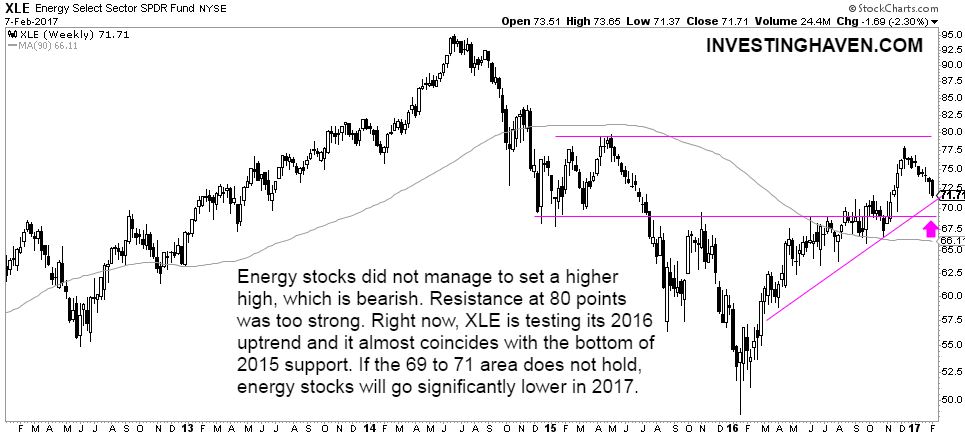
The long term XLE chart on 5 years shows that energy stocks were not able to set a higher high. The May 2015 top was recently tested, unsuccessfully. Resistance proved to be too strong, and XLE started heading lower.
Right now, the sector is about to test the rising trend (line). That coincides with the support area of the first months of 2015. Needless to say, this is a very important price level for energy stock investors. They very closely watch what happens in the 69 to 71 area. If that price level does not hold, it would trigger a bearish wave.
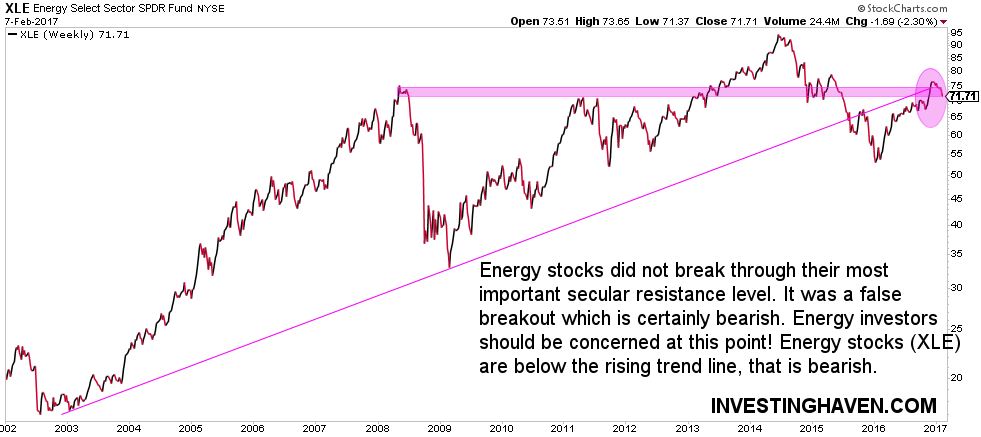
The picture seems even more concerning on the very long term chart. Energy stocks were not able to rise above the rising secular trendline. What’s more, a false breakout took place late last year as suggested by the purple circle and the horizontal purple resistance area. Overall, the picture on the very long term chart does not look rosy, and energy investors really get concerned if the price level around 70 points (mentioned in the above chart) would not hold.


