Ethereum is showing some signs of life again, finally. The strong correction that started early May lasted some full 8 weeks. On the last day of June all cryptocurrencies, including Ethereum, took off, and, today, there is another sign of strength. This is something we have not seen in 2 months, so it’s an encouraging sign. But how long may it take until Ethereum really takes off again, and breaks out to start a new bull market?
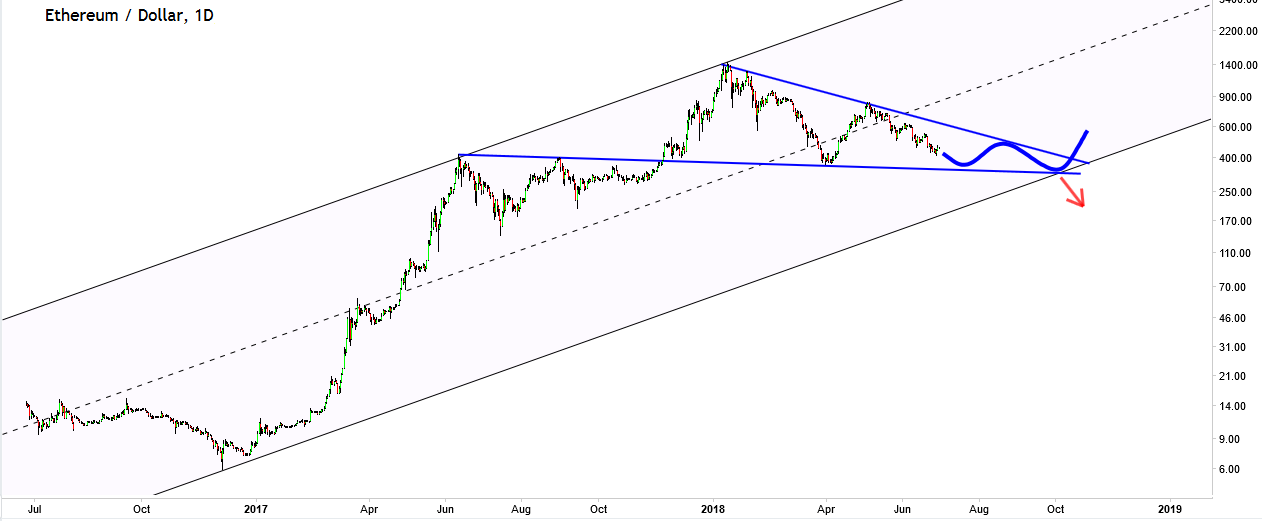
The answer to this question may be found on Ethereum’s daily price chart. Below is the log chart, and it shows a very clear pattern.
If the ongoing pattern that is unfolding will complete it will be the triangle annotated in blue. It will provide strong support around the 300 USD area, and it will be complete by October 2018.
Are we saying this is the scenario that will play out? No, nothing is sure in markets, and there is certainly another scenario that seems possible. Based on our latest Bitcoin At Crossroads: Flat Price Until The Start Of A New Trend it might be that Bitcoin starts acting strongly if it breaks out of its falling channel. Particularly, once it breaks out of the $7100 level, we might see a bullish period start again. Whether this will happen, short term, remains to be seen.
The point is this: Bitcoin, so far, has been the leading indicator for cryptocurrencies. It has lead cryptos higher at the start of strong rallies, but it was also the first to top out.
In other words, it is wise to look at Bitcoin in parallel with Ethereum for an Ethereum forecast.
Long term, we remain very bullish on crypto, and Ethereum specifically as well.


