EUFN, the iShares MSCI Europe Financials ETF tracks the investment performance of an index composed of European equities in the financials sector. We consider EUFN a good way to gain exposure to the financial sector in Europe and it also provides a good overview of the sector in the region for analysis purposes.
This article will provide our updated outlook for the European financial as we kickoff the 2nd quarter of 2018.
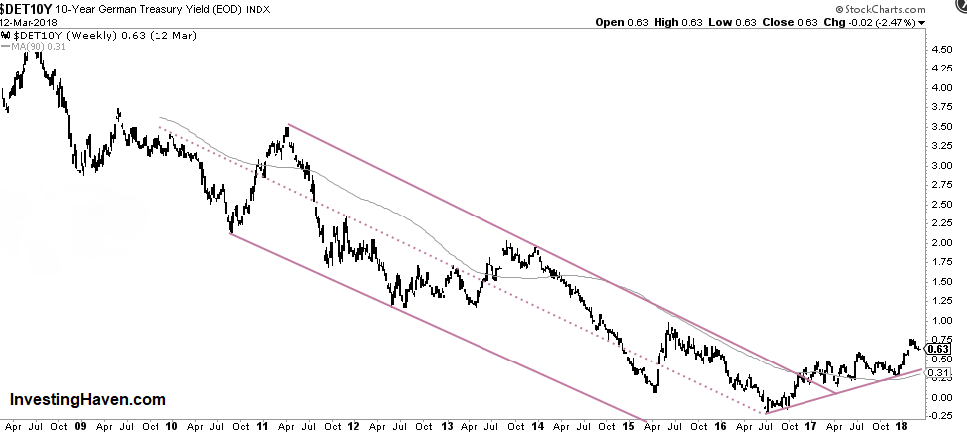
To provide an outlook for the European financial sector, we will start with the German interest rates that we consider a leading indicator. 9 months ago, we shared with our readers and alert about how the German Interest Rates are Starting a Major Trend Reversal. At press time, that trend seems to continue and we are seeing a series of higher highs and higher lows. However, German interest rates are reaching important resistance levels so we might see further sideways movement within a tighter range in 2018 given the overhead resistance in the 0.75 to 1% area.
On the long term, we are seeing what looks like a bottom in the German interest rates that will likely go up. The longer the consolidation the higher the potential to break through the resistance.
Our European Financial Sector Outlook is Bullish Long Term
Based on the following 3 charts, we believe the European Financial Sector is heading for a consolidation period prior to a strong Bullish move long Term.
The first chart shows how in December 2017, the sector broke through an important resistance level from 2014 and 2015, 22.40 and 23.40 respectively. We also noticed how the price went back in February 2018 to successfully backtest the 23.40 area. As long as that level holds, the price remains in a very Bullish zone for a long term hold.
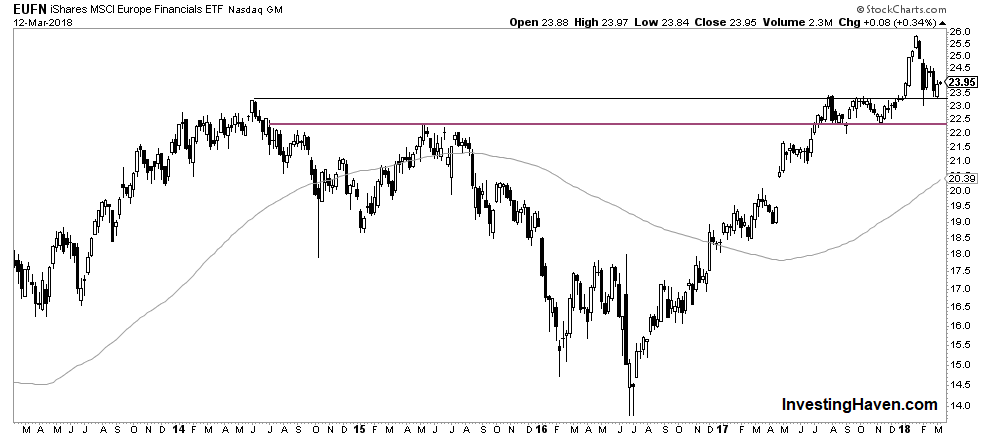
When we zoom in on the price performance for the last 2 years, 23.40 is clearly a breakout level that got back tested twice and held and will likely provide a strong support for the upcoming move in the European financial sector ETF.
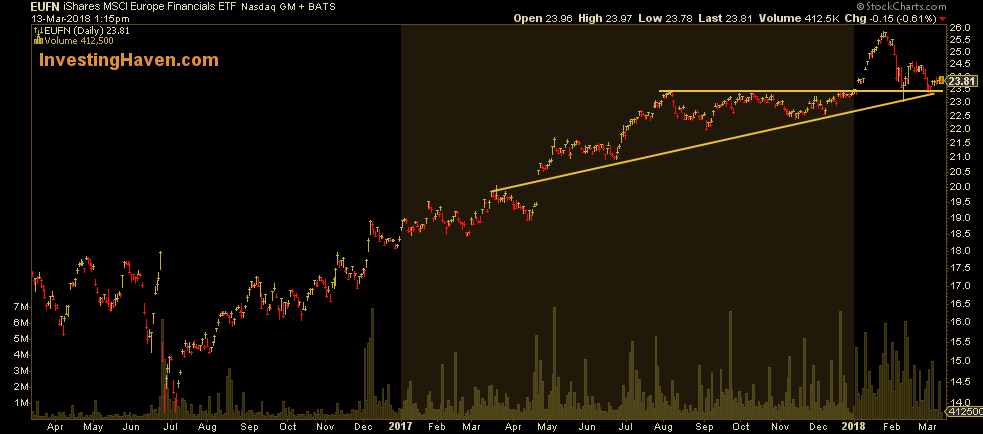
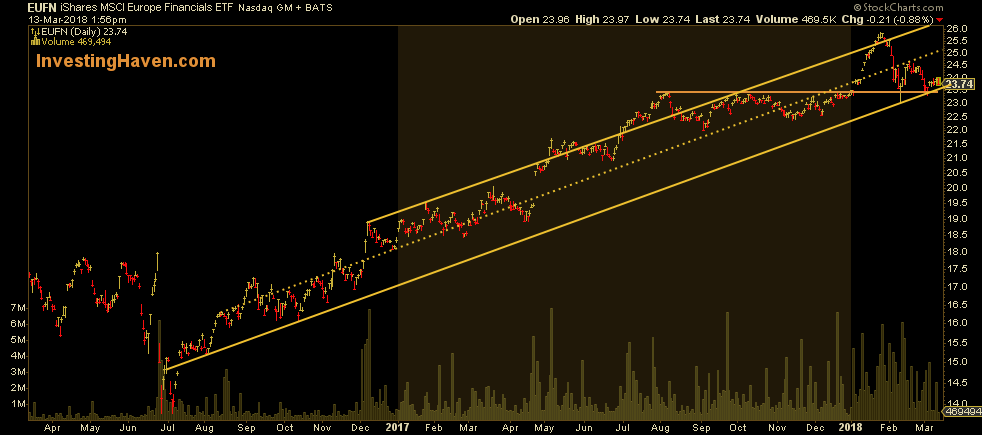
Last but not least, the EUFN ETF is clearly on a strong uptrend as shown in the chart below. The price is at the bottom of the ascending channel and has strong support from the intersection of both the Horizontal and diagonal support trendlines. The consolidtion range is likely to be in the 23.40 to 26 area prior to a potential breakout if it crosses above the top pf the channel.
