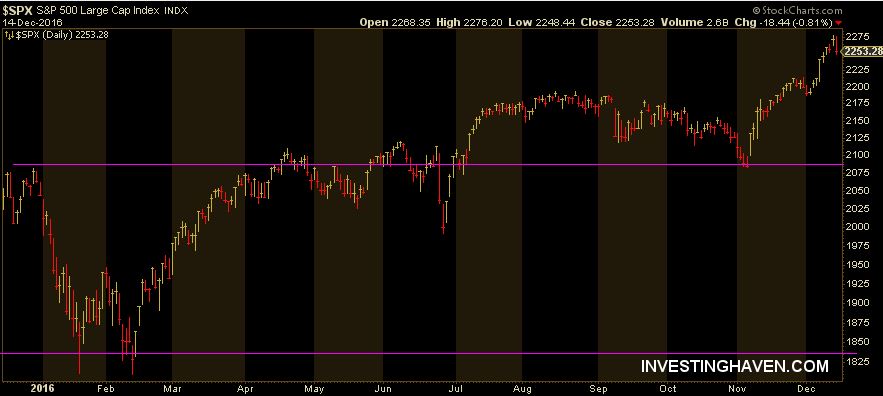
It now the time to sell stocks, as the Fed has hiked interest rates? The daily S&P 500 chart provides the answer, it suggests there is no reason to panick.
Basically, the S&P 500 chart is as simple as it can be. There are two support lines, which provide support going back to 2015 (not is everything is visible on this one-year chart though). The first part of this year was centered in the lower support area. After the summer, the stock index was trading above the upper support line. Early November, there was a final test of support, with a decisive break higher.
With today’s slight retracement from all-time highs, there is no reason to panick. Yes, the U.S. Fed hiked rates, but it was the second mini-hike so to speak in a decade.
After all, a retracement from all-time highs is as normal as it can be. We believe that this retracement can bring the S&P 500 index to the 2200 level, some 2 percent from today’s levels. Given our market outlook for 2017, we see the S&P 500 heading higher in the weeks and months to come. Things are lined up to sell in May of 2017, but readers should not take that as a prediction.


